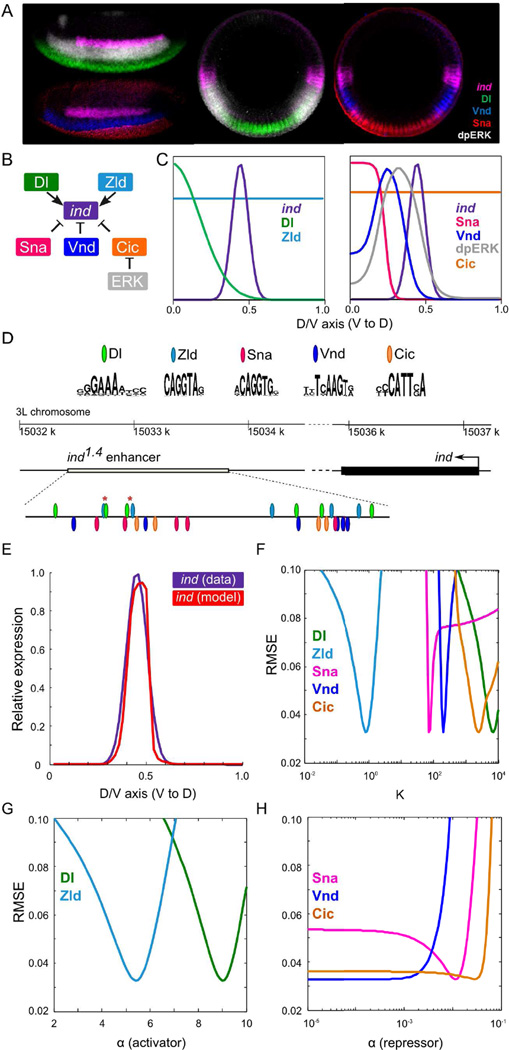
Figure 2.
Inputs to the model and an example of predicted ind expression from a wild-type model. (A) Lateral (left) and D/V cross-sections (right) of blastoderm stage Drosophila embryos. Embryos were stained with ind mRNA (magenta) and its four non-uniform regulators, Dl (green), Vnd (blue), Sna (red), and dpERK (gray). (B) Assumed relationships between ind and its regulators. (C) Expression profiles of ind and its regulators along D/V axis. (D) PWMs of the regulators and locations of computationally identified sites for TF binding. Asterisks mark the pairs of closely located Dl-Zld sites. (E) (i) Predicted ind expression (red) from a model optimized on wild-type data (purple). (ii – iv) Sensitivity plots for a model: panels show the RMSE scores of the model as the corresponding parameter’s value is varied within its range, keeping other parameters fixed at their optimized values. For brevity, the vertical axis is limited at RMSE = 0.10.

