Figure 4.
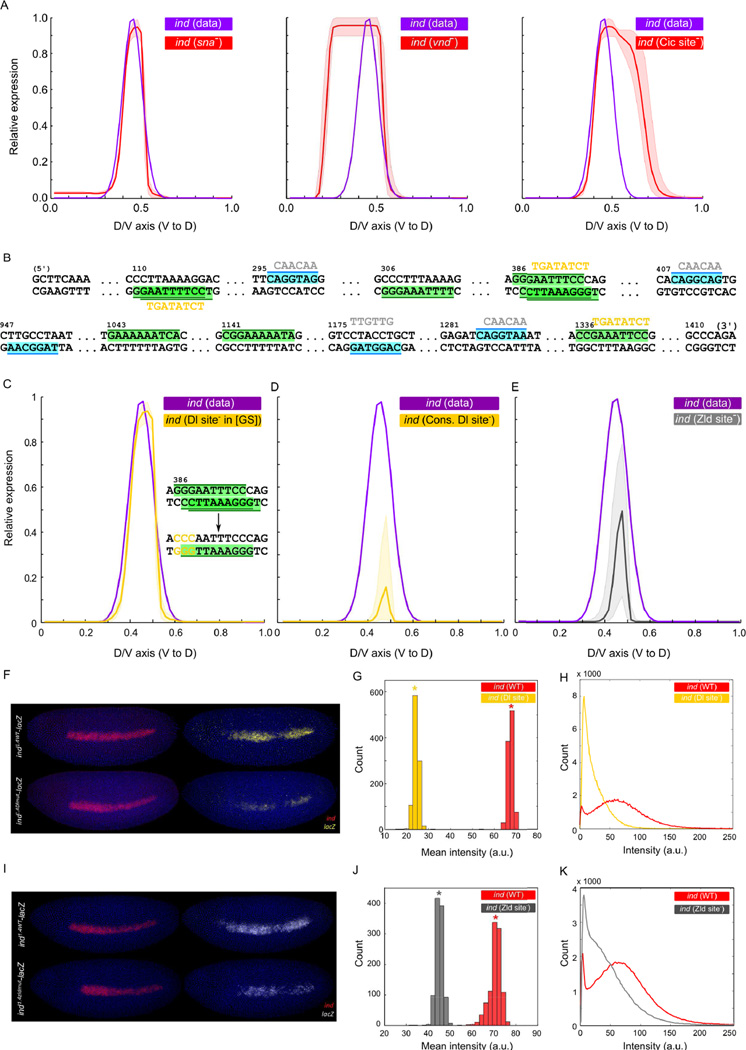
Predictions of the filtered ensemble and their experimental validations. (A) Predictions of filtered ensemble under perturbed conditions; left to right: mutation of sna, vnd, and two Cic sites in the ind enhancer. Shown are the mean (red) and the range (shaded red area around the curve) of ensemble-predictions. Plots in C, D, and E follow the same semantics. (B) Computationally identified sites for Dl (green) and Zld (cyan) in ind enhancer. Yellow and gray sequences show mutations to disrupt Dl and Zld sites, respectively. (C) Filtered ensemble models do not predict any significant change in ind expression upon the mutations reported in (Garcia and Stathopoulos, 2011); but (D) predict that ind expression nearly abolishes upon removing the additional sites for Dl. (E) Filtered ensemble models predict ~50% reduction in ind expression upon mutating Zld sites in ind enhancer. (F) The ind enhancer was used to drive expression that recapitulates the endogenous ind expression (ind1.4WT-lacZ) and Dl sites in the enhancer were mutated (ind1.4Dlmut-lacZ). Embryos were co-stained with ind (red) and lacZ (yellow). (G) Histograms of mean intensity values computed from bootstrapped profiles; asterisks mark bootstrapped mean values. (H) Smoothed histograms from wild-type and mutant lacZ profiles (each created from 20 profiles (one per embryo) on 256 bins (one per intensity value)). (I) Zld sites in the enhancer were mutated (ind1.4zldmut-lacZ). Embryos were co-stained with ind (red) and lacZ (white). (J), (K): plots analogous to (G), (H).

