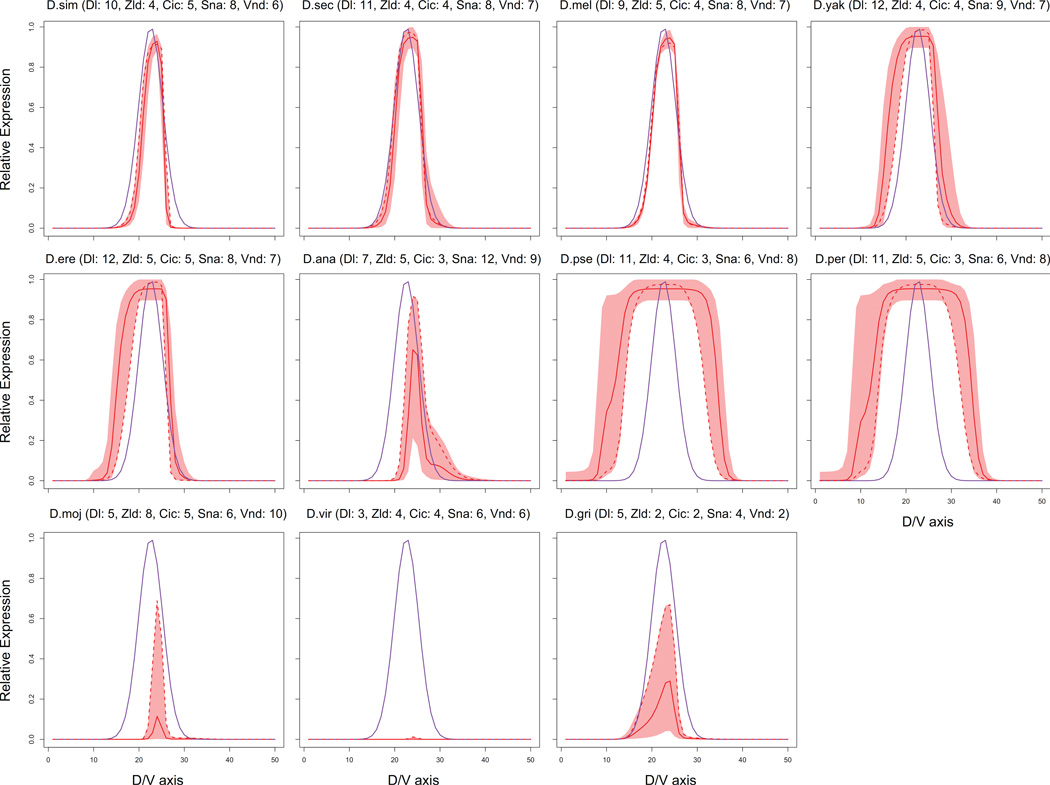
Figure 5.
Predictions of the filtered ensemble models for the orthologs of the D.mel ind enhancer in ten other Drosophilids. See the legend of Figure S1 for the details of how the orthologs were extracted. Semantics of the plots are the same as that of Figure 4A. We also show in parentheses the number of TF binding sites in each ortholog. Additionally, the dotted red curve for each ortholog shows the best prediction of a filtered ensemble model for the corresponding ortholog. The goodness of a model prediction for a given ortholog is defined as the sum of squared error between the model prediction and ind expression data in D.mel.

