
Fig. 4.
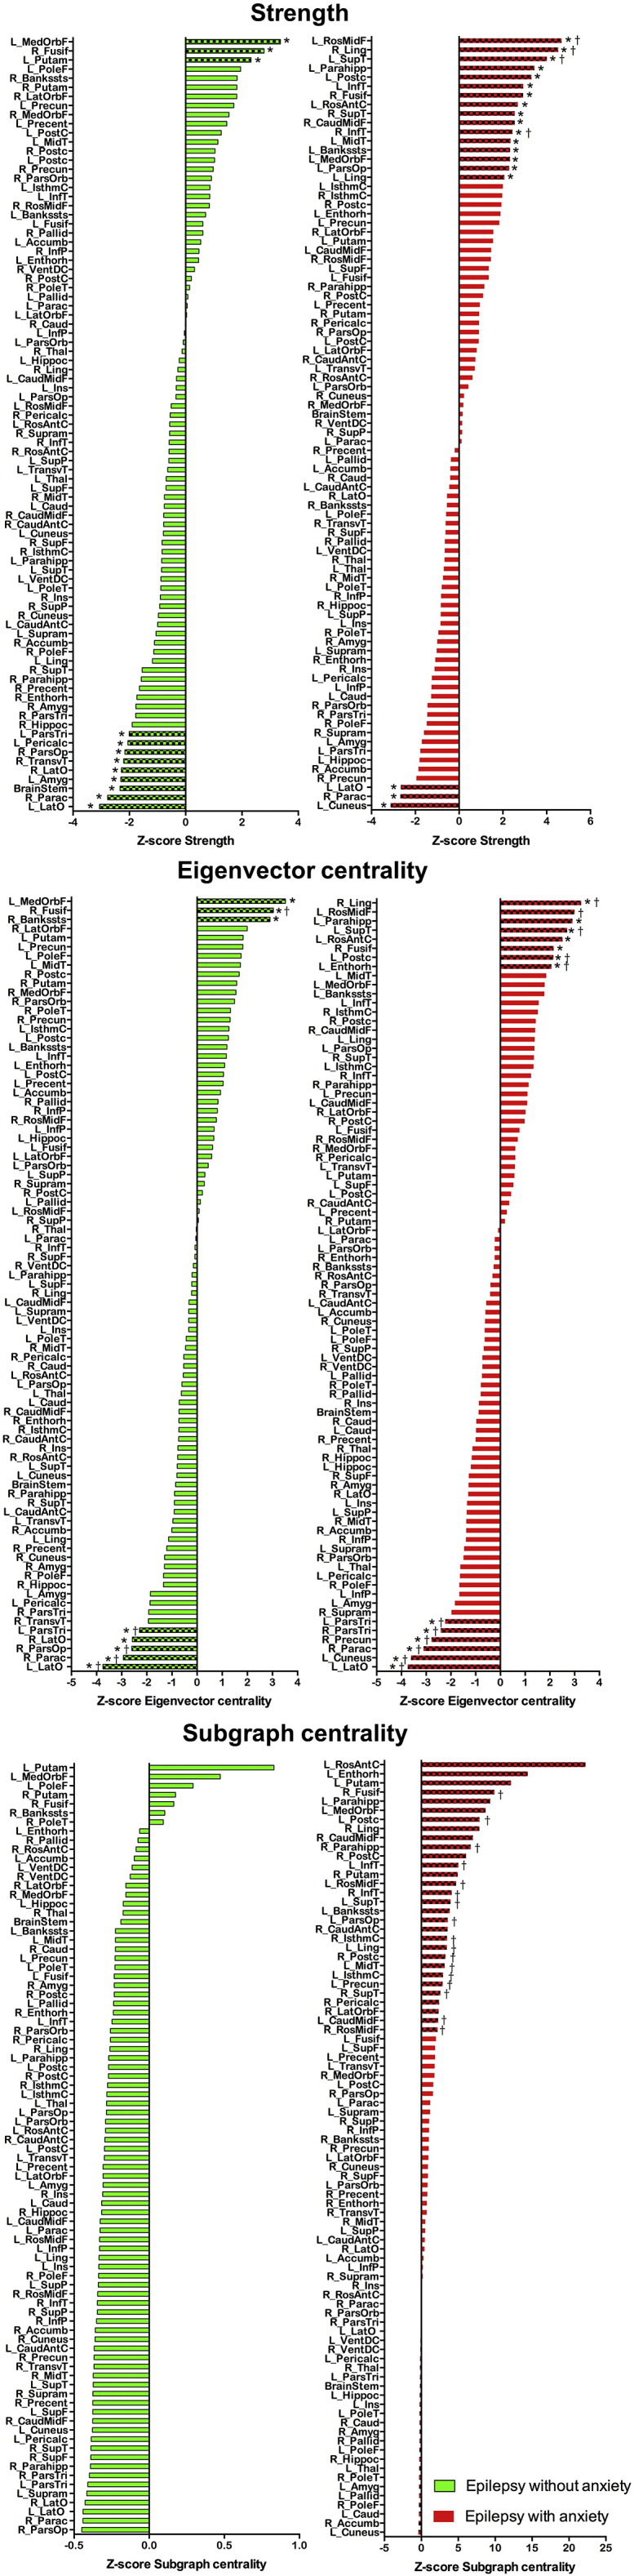
Centrality measures. Ranked Z-score distribution for node strength (top), eigenvector centrality (middle), and subgraph centrality (bottom) on children with epilepsy without anxiety disorder (green), and children with epilepsy with anxiety disorder (red) with respect to controls. Bars with different pattern represent nodes with a Z-score value > 2 or lower than − 2. Calculated at a threshold of 26%. *Statistically significant (corrected for multiple comparisons) against zero (null hypothesis); †Statistically significant between the given group and controls (corrected for multiple comparisons). (For interpretation of the references to color in this figure legend, the reader is referred to the web version of this article.)