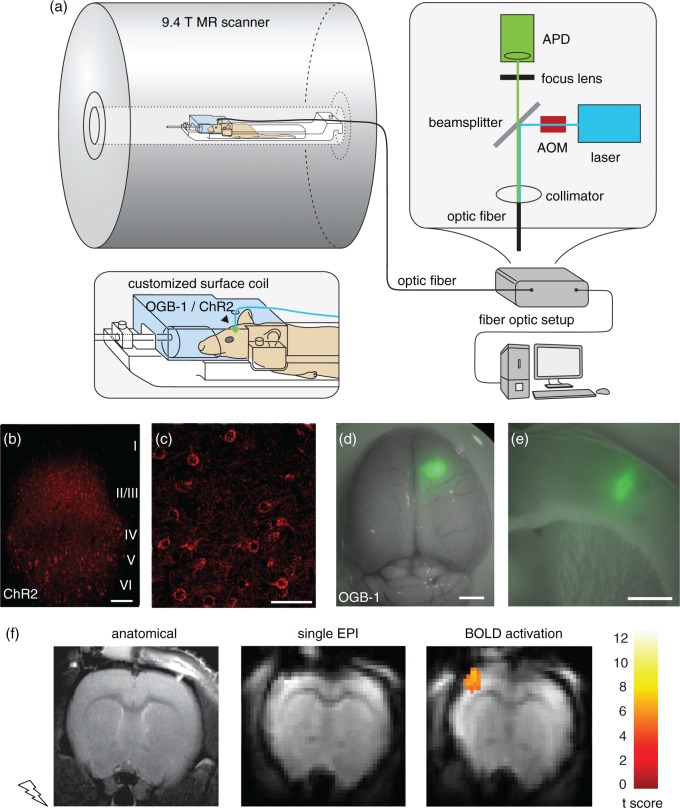
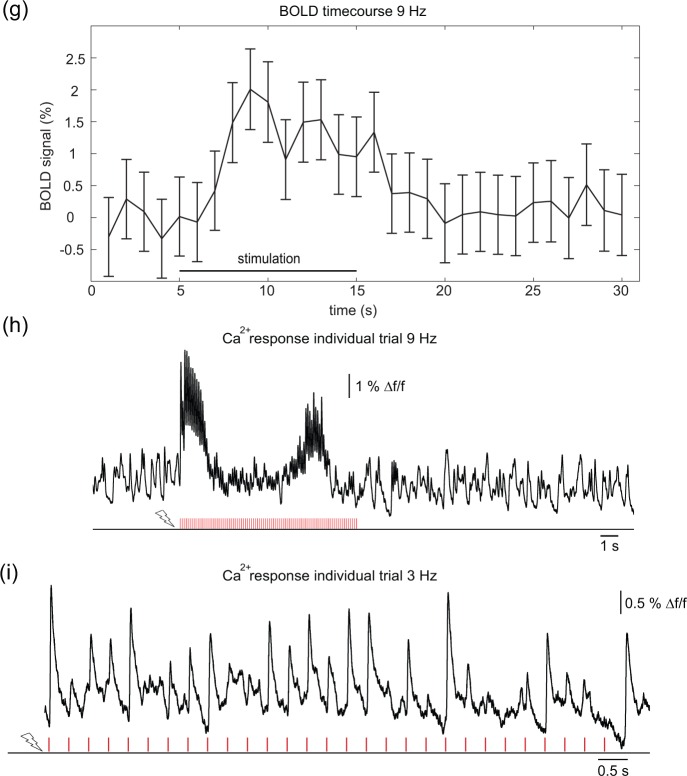
Figure 1.
Setup for simultaneous optical recordings and optogenetic stimulation during BOLD fMRI. (a) Scheme of experimental setup. Optic fiber-based stimulation/recording setup is placed outside of the scanner cabin. Light intensities of the blue laser are modulated with high temporal precision by use of an acousto-optic-modulator (AOM), emitted light is recorded by an avalanche photodiode (APD). The customized surface coil has a lead-through for the optical fiber. Electric stimulation, laser excitation, fMRI data acquisition, and optical recordings are synchronized with a customized LabView program. (b, c) Confocal images from fixed sections of rat brain injected with ChR2-mCherry AAV in somatosensory cortex. (b) mCherry expression in cortical layers II/III, V, and VI becomes evident. Note that layer IV does not exhibit fluorescence; scale bar = 100 µm. (c) High-resolution imaging reveals membrane-bound localization of ChR2-mCherry fusion protein; scale bar = 50 µm. (d, e) Photomicrographs of rat brain injected with Ca2+ indicator OGB-1. (d) Whole rat brain, overlay of transmitted light image with green fluorescence channel; scale bar = 2 mm. Spatially confined area of OGB-1 staining is visible in right somatosensory cortex. (e) Coronal brain slice at the level of the somatosensory cortex of OGB-1 fluorescence; scale bar = 1.5 mm. Staining is restricted to the cortex, with a diameter of approximately 600 µm. (f) Anatomical RARE (left) and functional EPI MR images (center) of one animal, and BOLD activation map showing response upon forepaw stimulation (10 s at 9 Hz, 1 mA, 1 ms) overlayed on mean EPI image (right). The color scale represents the t-score of the BOLD analysis. (g) Averaged BOLD time course of experiment shown in (f). (h) Ca2+ responses from same experiment as (f, g). (i) Primary Ca2+ responses induced by forepaw stimulation at 3 Hz, 10 s pulse train.


