Figure 2.
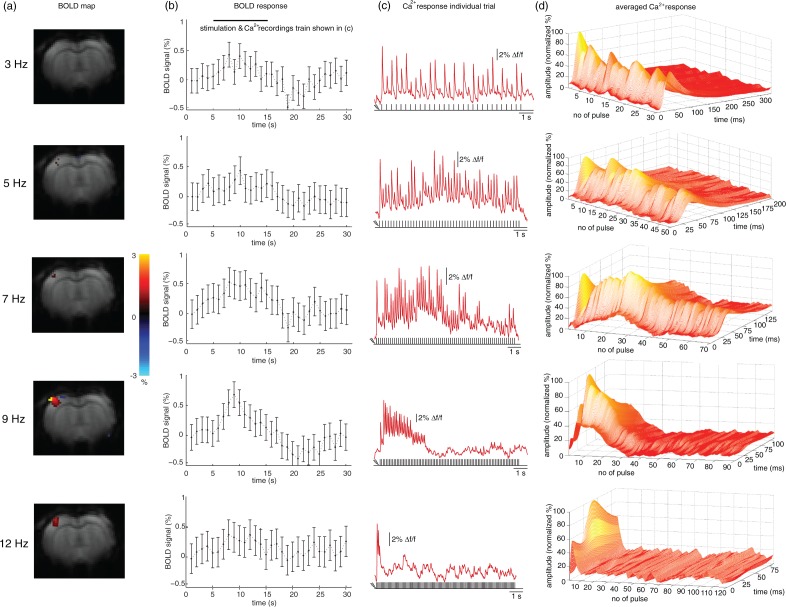
Impact of varying stimulation frequencies on BOLD activation and Ca2+ responses. Rats were subjected to forepaw stimulation at different frequencies with a pulse train duration of 10 s. (a) Exemplary BOLD maps from one animal. Weak activation was observed at 5 and 7 Hz, strong activation at 12 Hz, and strongest activation at 9 Hz. Color bar represents % signal change. (b) Averaged BOLD time courses in S1FL upon stimulation (four animals, eight experiments). Ten-second stimulation period is indicated on top (from 5 to 15 s). (c) Exemplary single-trial Ca2+ responses upon stimulation are shown only for the stimulation period (5–15 s) as indicated in (b). The number of evoked responses decreased at high frequencies (9 and 12 Hz). (d) Averaged Ca2+ responses of stimulation periods of entire trials (one animal). 3D graphs show normalized amplitude (vertical axis), number of pulses within the stimulation sequence (horizontal axis), and interstimulus intervals (time axis). Response amplitudes were similar for all stimulation pulses within a stimulation sequence at low frequencies (3 and 5 Hz). At 7, 9, and 12 Hz increasing adaptation became apparent. Note the different lengths of time axes due to the decrease of the interstimulus interval with higher stimulation frequency.

