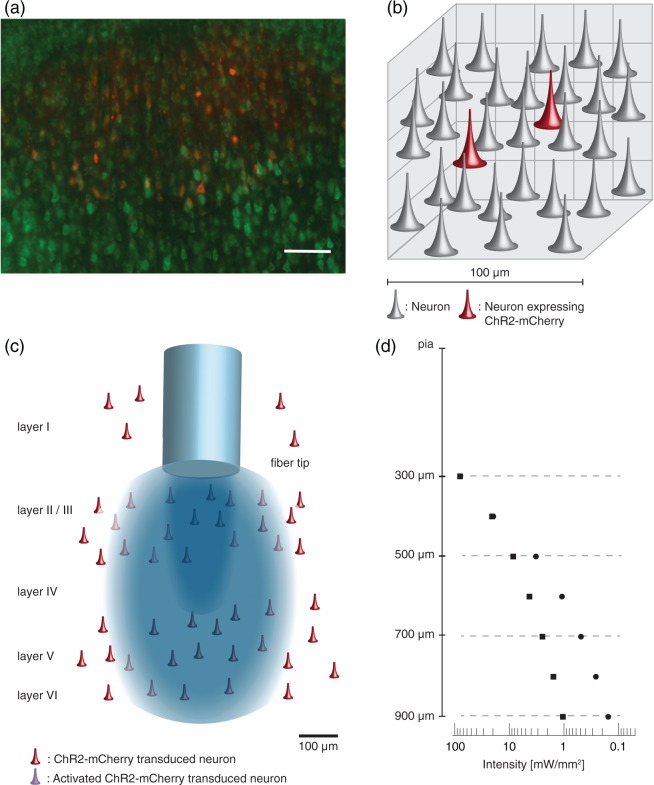
Figure 3.
Assessment of the density of ChR2-expressing neurons and their optogenetically activated subset. (a) Fluorescence micrograph, used for cell quantifications, displaying all neurons in green (Neurotrace staining), and the subset of ChR2-mcherry-expressing neurons in red. Coronal section at the level of layer V. Scale bar = 100 µm. (b) Schematic of a 100 µm3 tissue volume illustrating the average number of neurons and portion of transduced neurons in somatosensory cortex. (c) Scheme of distribution of ChR2-expressing neurons in cortex and illumination with blue light emitted from optical fiber. (d) Logarithmic plot of light attenuation calculated with Aravanis model (squares) and spherical model (circles). Vertical scale is also valid for (c).

