
Figure 2.
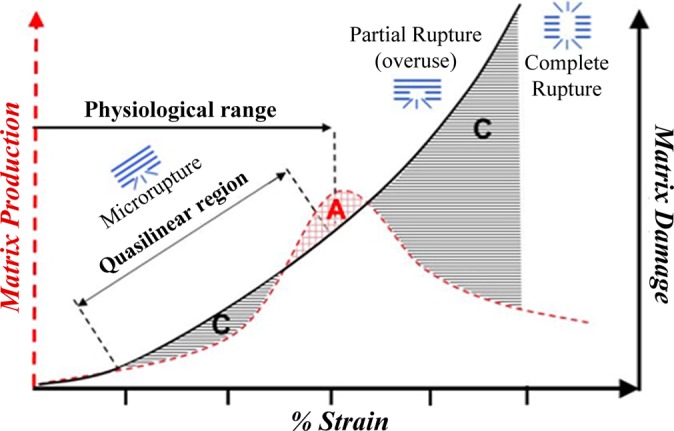
The effect of mechanical loading on tendon homeostasis. The black curve represents matrix damage with increasing strain. The red dotted curve represents matrix production by tenocytes. Zone “A” indicates the anabolic zone where matrix production overcomes matrix damage, such that the tendon can maintain its structural integrity. There are 2 “C” zones (catabolic zones) in which matrix disruption overcomes production, leading to tendinopathy. Image adapted from Wang et al102 with permission.