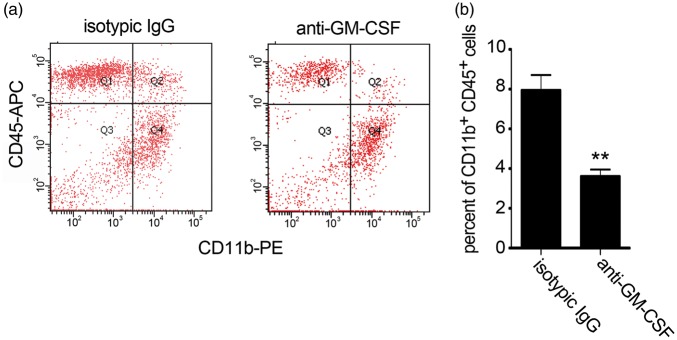
Figure 6.
Flow cytometric analysis of microglial accumulation in APP mice after intracerebral GM-CSF blockade. (a) Flow cytometry dot plots from an analysis of CD11b- and CD45-stained brain cells. (b) Flow cytometric quantitation of the percent of total CD11b+CD45+ brain cells (n = 4 mice for isotypic IgG group, 3 mice for anti-GM-CSF group). Two-tailed t-test was performed to compare transmigrated CD11b+CD45+ brain cells. **p < 0.01 vs. isotypic IgG intracerebral injected mouse brains.

