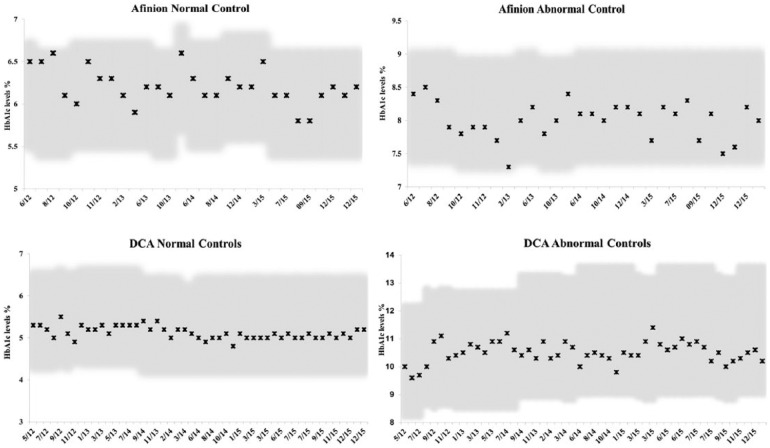
Figure 1.
Normal and abnormal control values for the POC assays. (a) Afinion normal control values. The values obtained for each control lot are plotted for each date assayed. The permissible range supplied by the manufacturer is the shaded area. (b) Afinion abnormal control values. (c) DCA normal control values. (d) DCA abnormal control values.

