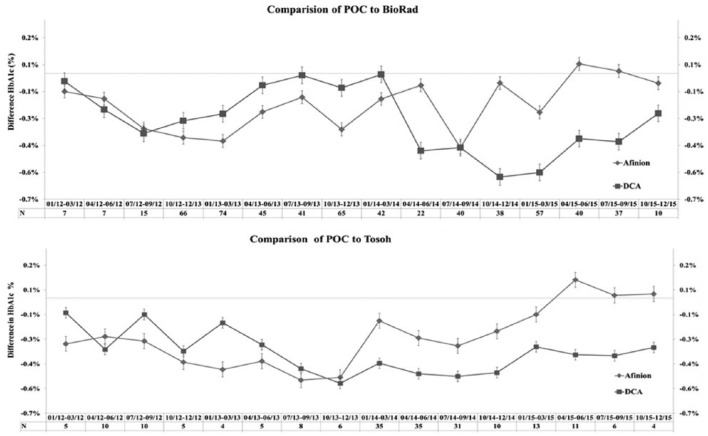
Figure 5.
Comparison of HbA1c values on Afinion and DCA to central lab values. (a) Afinion (diamond) and DCA (square) values were compared for each sample with the Biorad results over each 3-month period. The difference (either positive or negative) from the Biorad result for each sample is graphed for the 2 techniques. The number of total samples (N) for each 3-month comparison is listed. (b) Comparison of Afinion and DCA values to Tosoh results.

