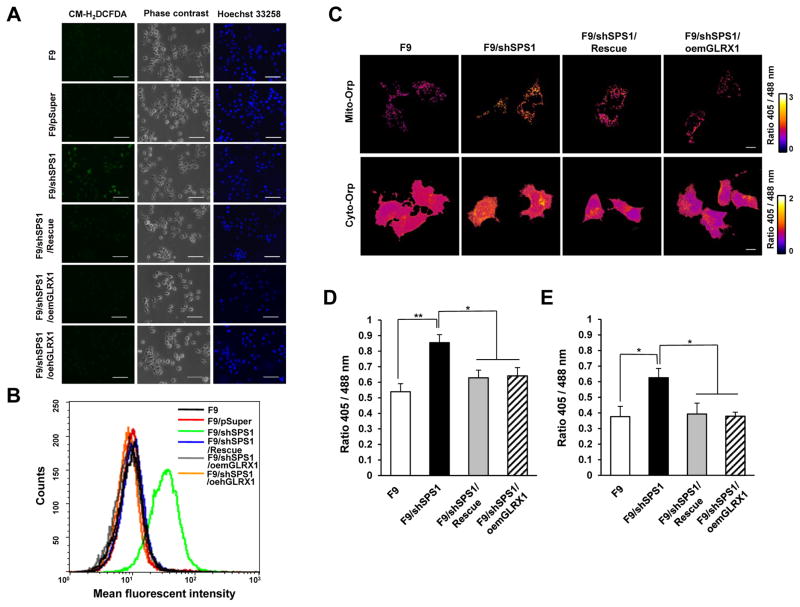
Figure 4. Accumulation of intracellular hydrogen peroxide in SPS1-deficient F9 cells.
(A) Cells were stained with CM-H2DCFDA to detect intracellular ROS and then counterstained with Hoechst 33258 as described in the Experimental section. The cells were photographed under a fluorescence microscope. Scale bars represent 100 μm. (B) Measurement of intracellular ROS levels. After the cells were stained with CM-H2DCFDA, ROS levels were measured using FACS. Representative FACS plot showing the amount of intracellular ROS. (C–E) Detection of intracellular hydrogen peroxide using roGFP2-Orp1 probes. (C) Vectors encoding mitochondrial roGFP2-Orp1 or cytosolic roGFP2-Orp1 were transfected into SPS1-deficient F9 and control cells and the 405/488 nm ratio images were obtained as described in the Experimental section. Scale bars represent 10 μm. Quantification of microscopy data of mitochondrial (D) and cytosolic (E) hydrogen peroxide. Emission ratios from six randomly selected fields (100× image) for each sample were averaged. Error bars represent standard deviation. * and ** denote statistically significant differences at P < 0.05 and P < 0.01, respectively.

