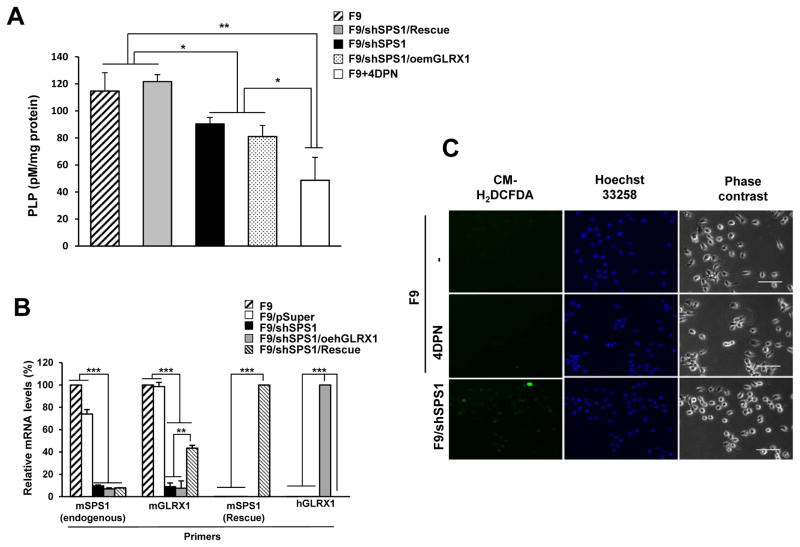
Figure 5. Measurement of intracellular PLP levels and their effect on ROS generation.
(A) After cells were cultured, PLP levels were measured as described in the Experimental section. Treatment with 4-DPN was used as a control. Data shown are representative of three independent experiments. (B) mRNA levels were measured by qPCR. cDNAs were amplified using specific primer sets as described in the Experimental section. β-actin was used as an internal control. Statistical significance was tested by one-way ANOVA followed by Tukey’s multiple comparison tests. Error bars represent standard deviation. *, **, and *** denote statistically significant differences at P < 0.05, P < 0.01, and P < 0.001, respectively. (C) The effect of inhibition of PLP biosynthesis on ROS generation. F9 cells were incubated with 4-DPN overnight and stained with DCFDA. F9/shSPS1 was used as a positive control. Scale bars represent 50 μm.

