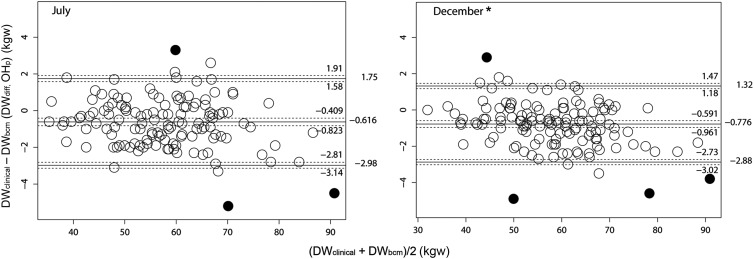
Fig. 2.
Modified Bland–Altman analyses as suggested by Ludbrook [11] were used in method comparison for the dry weight determined by clinical symptoms (DWclinical) and by BCM-BIS (DWbcm) in July and December. Outliers (black dots) were marked and excluded from calculation by bivariate boxplot analysis with bvbox () function in R. The mean values of DWdiff (middle solid line) with limits of agreement (upper and lower solid lines) are shown with their 95% CIs (dash lines). The actual values were also shown on the right. The range of limits of agreement in November and December was significantly narrower than the range in July, August and September due to significantly lower upper limits. Only data of July and December are shown (*n = 133 for each panel).

