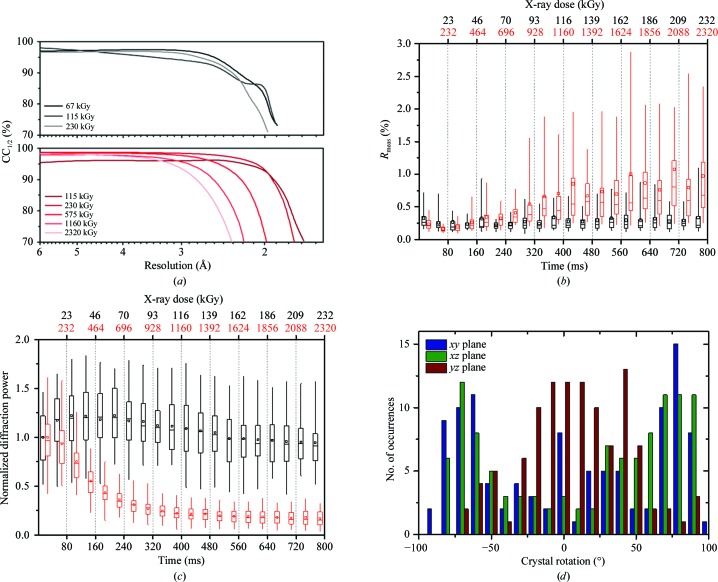
Figure 2.
Statistics from room-temperature data collection from thaumatin crystals in the Kapton-foil sandwich. (a) CC1/2 values of the recorded diffraction data for the low-dose (black) and high-dose (red) experiments are plotted as a function of resolution. (b) Evolution of the R meas value over time in the low-dose (black boxes) and high-dose (red boxes) experiments. (c) Intensity decay of thaumatin crystals as a function of time in the low-dose (black boxes) and high-dose (red boxes) experiments. The box plots in (b) and (c) represent the decay of diffraction intensities and R meas of all exposed crystals (n = 46). The box represents the spread of 50% of all values, which are separated into the upper and lower quartiles by a horizontal band (median); the mean value is indicated by a small rectangle. Whiskers (vertical lines above and below the box) indicate the spread of 95% of all values. (d) Distribution of thaumatin crystal orientations in the Kapton-foil sandwich with respect to the laboratory coordinate system. The bipyramidal thaumatin crystals showed a broad distribution of orientations covering nearly 180° in the xy (blue), xz (green) and yz (red) planes.

