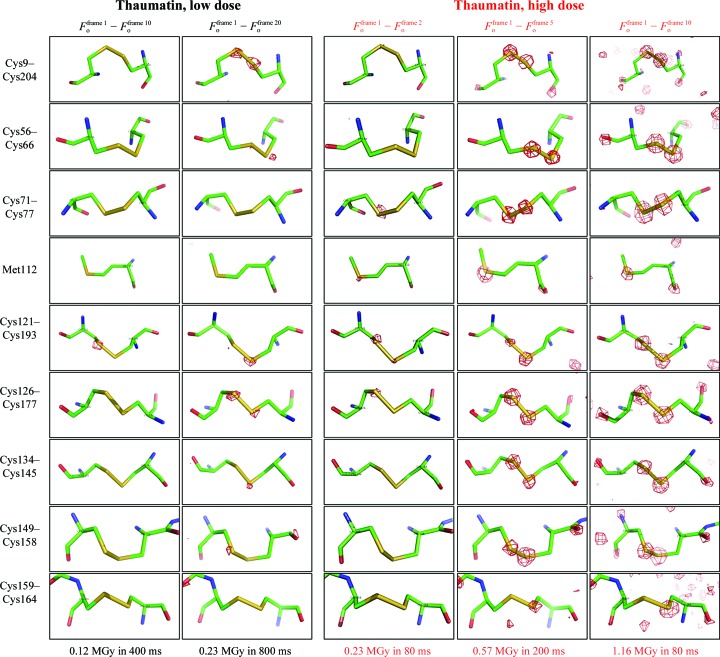
Figure 3.
Time-resolved observation of specific radiation damage around all S atoms of thaumatin over time. Structure-factor amplitude Fourier difference maps F o − F o were calculated between different time intervals of X-ray exposure for the low-dose (left side, black) and high-dose (right side, red) experiments. The maps are displayed with red contours at 4σ indicating negative electron density.

