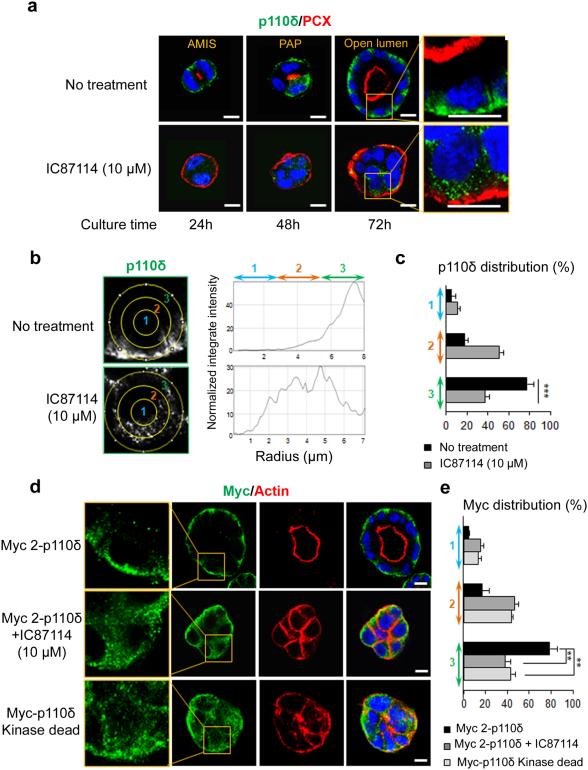
Figure 4. p110δ localization at the basolateral membrane of MDCK cysts depends on its activity.
(a) Time course analysis of p110δ in MDCK cells grown on Matrigel to form cysts and treated or not with IC87114 at 10 μM. Cysts were fixed and stained after 24, 48 and 72 h of culture. Immunostaining was performed for p110δ (green) using p110δ-specific antibody (ab32401), PCX (red) and Hoechst (blue) as indicated on the pictures. Single confocal section through the middle of cyst is shown. The scale bar represents 10 μm. A higher magnification of the data from 72 h of culture is presented in the right column. (b) The distribution of p110δ signal was analyzed by ImageJ software in an individual cell from a cyst. A circle was defined at the periphery of each cell and the plugin produces a profile plot of normalized integrated intensities around concentric circles as a function of distance from a point in the image, considered here as the centre of the cell. The circle was divided in three bands (1, 2, 3) with equal radius. (c) The total intensity in each band was calculated from 20 cells and is represented as a histogram. values are expressed as mean ± s.e.m Triple asterisks indicate student t test P<0.0001. (d) MDCK cells transfected with 1 μg of Myc 2-p110δ cDNA were treated or not with 10 μM of IC87114. MDCK cells were also transfected with 1 μg of Myc-p110 kinase dead (KD) cDNA. Immunostaining was performed for Myc (green), actin (red) and Hoechst (blue) as indicated on the pictures. Single confocal section through the middle of the cyst is shown. A higher magnification of the data is presented in the right column. The scale bar represents 10 μm. (e) The distribution of Myc signal was analyzed by ImageJ software in an individual cell from a cyst as in (b), and total intensity in each band calculated from 20 cells was represented as histogram. values are expressed as mean ± s.e.m . Double asterisks indicate student t test P<0.001.

