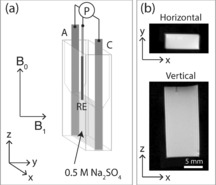
Figure 2.

a) Schematic diagram of the MRI corrosion cell, showing the anode (A), cathode (C), and Ag/AgCl reference electrode (RE), along with their connections to potentiostat (P). b) Vertical and horizontal 1H MR images of a 0.5 m Na2SO4 electrolyte in the electrochemical cell. In the vertical image, the Ag/AgCl reference electrode tip is just visible at the top of the cell as a small vertical black line. The slice thickness for the horizontal image is the full depth of the cell (along z) and the slice thickness for the vertical image is the full thickness of the cell (along y).
