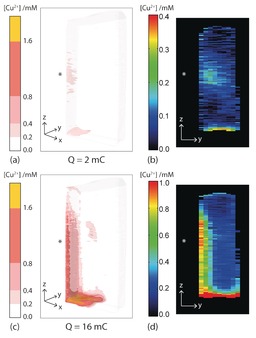
Figure 5.

3D (a,c) and 2D (b,d) concentration maps of Cu2+ ions dissolved in 0.5 m Na2SO4 electrolyte following the electodissolution of the Cu anode. The images in (a,b) was acquired after delivery of 2 mC of charge and the images in (c,d) after 16 mC of charge. The pixel size is 500 μm(x)×500 μm(y)×188 μm(z), and the asterisk indicates the region on the anode that was scratched immediately prior to filling the cell with electrolyte. The 2D images in (b) and (d) are of the electrolyte layer (500 μm thick) immediately adjacent to the anode surface, and were extracted from the 3D maps shown in (a) and (c), respectively.
