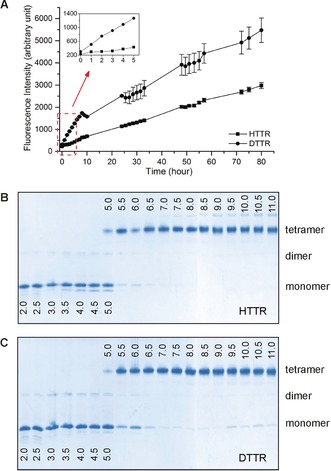
Figure 2.

A) ThT fluorescence intensities measured during the fibrillation of HTTR and DTTR (λ ex=440 nm, λ em=480 nm). Each data point is the average of triplicate measurements. The error bars represent the standard deviations. B) HTTR and C) DTTR tetramer stability as a function of pH. The pH value is indicated on each lane. Three major bands were detected, corresponding to TTR tetramer (56 kDa), dimer (28 kDa), and monomer (14 kDa).
