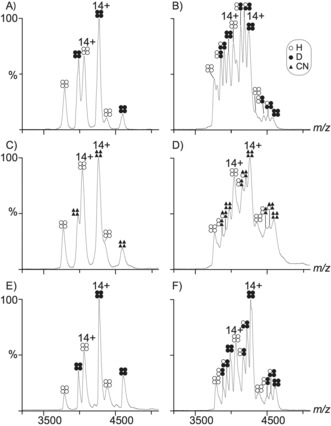
Figure 3.

Native MS spectra of mixed unlabeled and isotope‐labeled TTR. A) 38 minutes after mixing HTTR and DTTR. In the spectrum six peaks are present matching the masses of the unlabeled (4H) and labeled (4D) TTR homo‐tetramers. B) TTR spectrum after 8 days of the HTTR and DTTR mixing. C) TTR spectrum 7 minutes after mixing 4H and 4CN. D) The same reaction was monitored after 10 days. H‐ammonium acetate was used for the samples shown in A–D. E) 7 minutes after mixing HTTR and DTTR. F) TTR spectrum after 8.8 days of mixing HTTR and DTTR. d‐ammonium acetate dissolved in D2O was used for the samples in (E) and (F).
