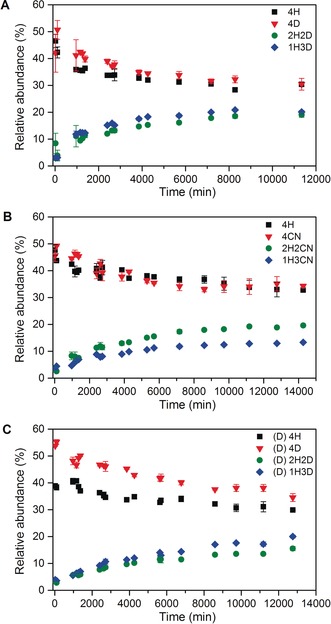
Figure 4.

The changes in relative abundance of each species during the subunit exchange between A) HTTR and DTTR, B) HTTR and CNTTR, both in H‐ammonium acetate, and C) HTTR and DTTR in d‐ammonium acetate. Each data point is the average of 2–4 replicate measurements. The error bars represent the standard deviations.
