Figure 1.

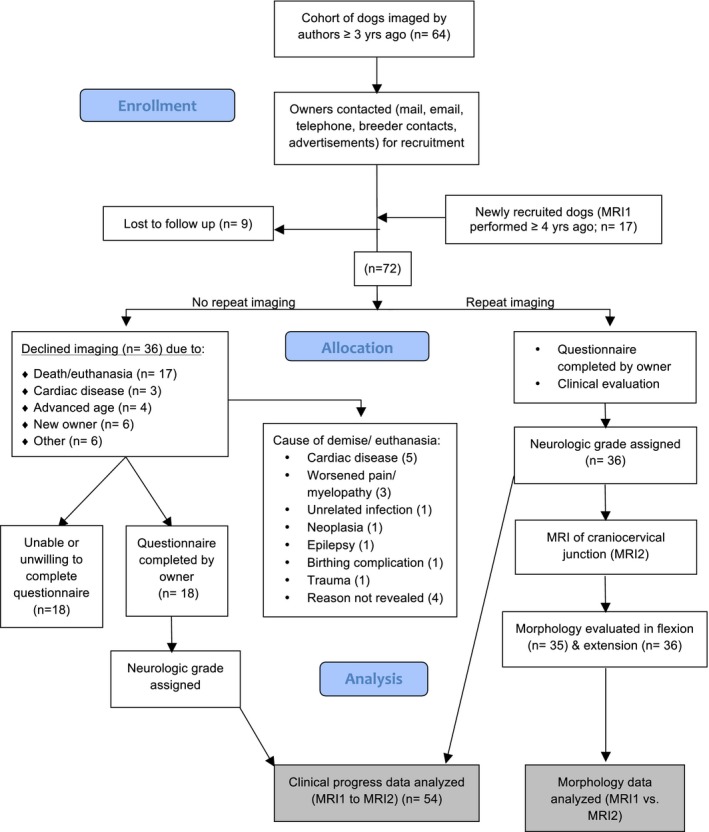
CONSORT‐style diagram. This flowchart illustrates the recruitment, loss to follow‐up, and study group assignment of initial and current study participants.

CONSORT‐style diagram. This flowchart illustrates the recruitment, loss to follow‐up, and study group assignment of initial and current study participants.