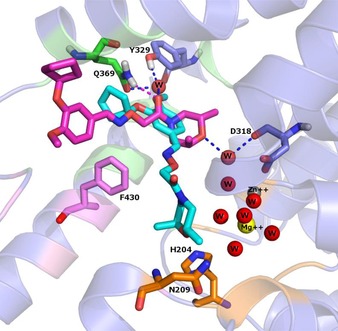
Figure 5.

The conformations of compound 1 before (cyan) and after (magenta) the MD simulation. The main amino acids residues are shown in sticks, the enzyme is shown in cartoon diagram. The residues forming the M, Q and S pockets displayed in cartoon diagram are coloured orange, pink and green respectively. Zinc and Magnesium ions are represented as spheres and the H‐bonds between each ligand and the active site amino acids are shown in magenta dashed line. The water is represented as sphere and water bridged H‐bonds are shown as blue dashed lines.
