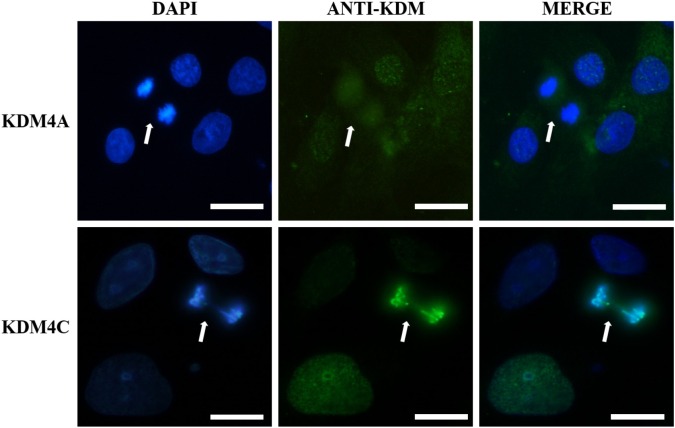
Figure 1.
KDM4A and KDM4C cellular localization during mitosis. Representative immunofluorescent images of HCC38 cells in anaphase are presented (white arrows), illustrating a different distribution pattern for both proteins. Note that KDM4C colocalizes with DNA signal detected with DAPI, while KDM4A is excluded from mitotic chromosomes. The presented localization is conserved along all cell lines included in the study. White scale bar: 10 μm.

