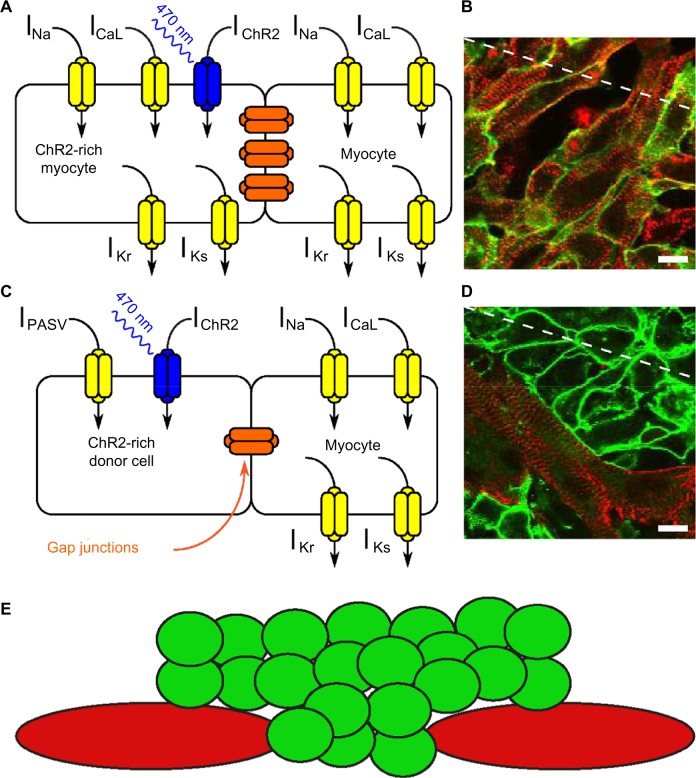
Figure 1.
(A) Simplified schematic representation of ionic currents in a myocyte expressing the opsin ChR2 following gene delivery. (B) Superimposed immunofluorescence images in a cardiomyocyte monolayer following gene delivery of ChR2. Red: α-actinin, a myocyte marker; green: ChR2, marked with the reporter protein EYFP. (C) Schematic representation describing the cell delivery approach. A light-excitable donor cell expressing ChR2 (left) is connected with a myocyte (right) by gap junctions. (D) Superimposed immunofluorescence images in a cardiomyocyte monolayer following cell delivery of ChR2-expressing donor HEK cells. Red: α-actinin, a myocyte marker; green: ChR2. (E) Two-dimensional representation of donor cell (green) distribution over a cardiomyocyte (red) monolayer. Reproduced with permission from Ambrosi et al.34

