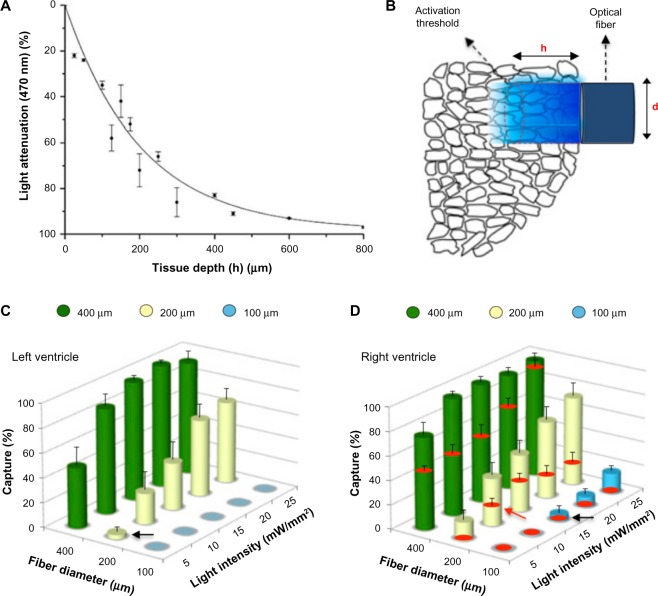
Figure 5.
Interrogation of the minimal myocardial volume to trigger ectopic beats. (A) Attenuation of blue light at various tissue depths. (B) Schematic representation of tissue illumination by an optical fiber of diameter, d; the penetration depth, h, is a function of light intensity. (C and D) The cylinders show the capture rate of ectopic beat induction with light as a function of the fiber diameter d and the light intensity. The red disks in (D) indicate the capture after application of Lugol’s solution, which ablates the Purkinje system along with parts of the endocardium. Reproduced with permission from Zaglia et al.49

