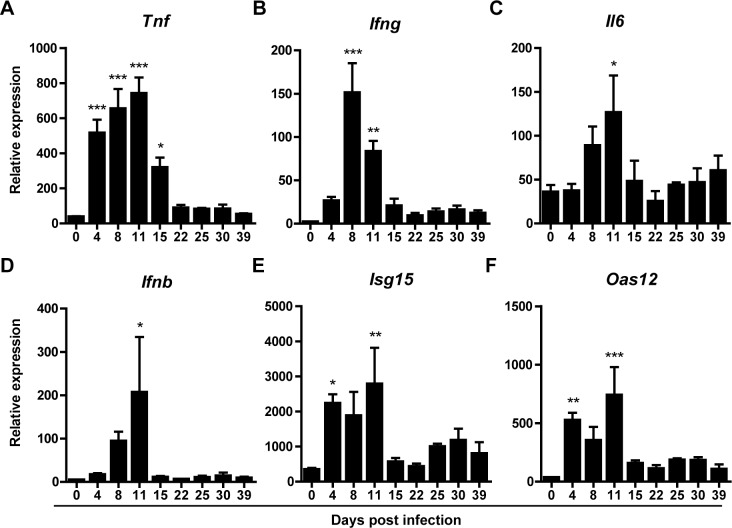
Fig 2. Hepatic cytokine and interferon transcript levels increase during the peak of LCMV replication but normalize thereafter.
Whole liver RNA was isolated from LCMV infected mice at regular intervals and analyzed for transcription of inflammatory cytokines Tnf, (A) Ifng (B), Il6 (C), Ifnb (D) and interferon induced genes Isg15 (E) and Oas12 (F) using qPCR. Given values on y-axes are relative expression to GAPDH. X-axes shows days post infection. Error bars indicate mean ±SEM. Significance of each time point was assessed using one-way Anova with Dunnett’s Multiple comparison test to day 0. *p<0.05, **p<0.01, ***p<0.001.

