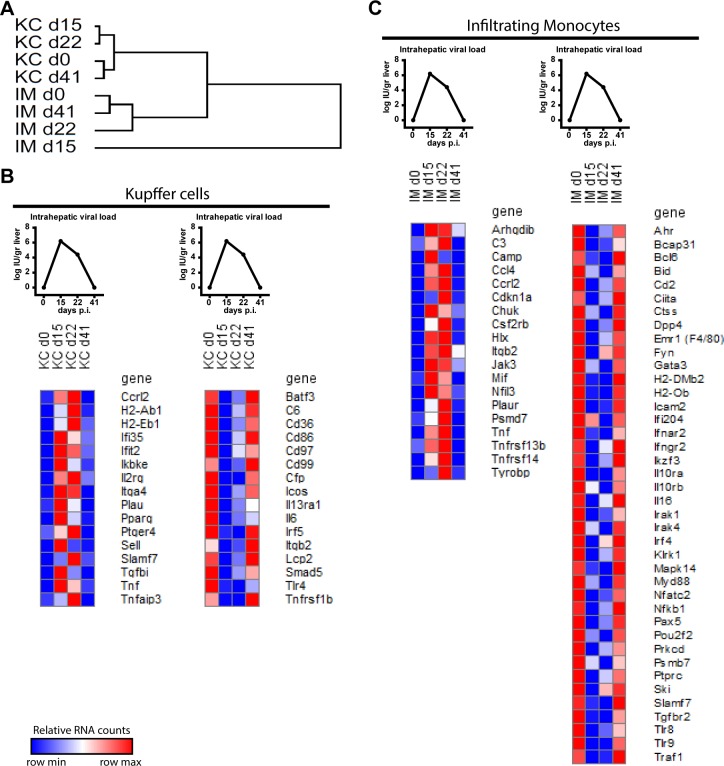
Fig 5. Kupffer cells and infiltrating monocytes exhibit a distinctive viral antigen associated gene expression.
Hierarchical cluster of complete transcriptome of sorted KC and IM (A). Gene upregulation (left) and down regulation (right) associated with presence of viral antigens in the liver of KC (B) and IM (C). Viral antigen plots show simplified Fig 1C (B, C). Dark red indicates row max value, dark blue indicates row min value (B, C).

