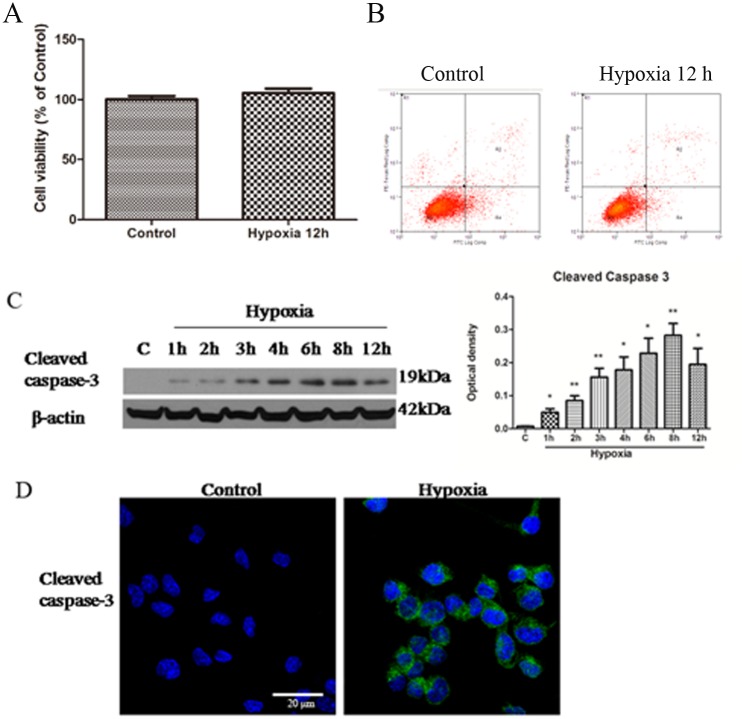
Fig 1. Hypoxia induces caspase3 expression without affecting cell viability in microglia.
A. Bar graph shows the viability of BV-2 cells after hypoxia for 12 h compared to control by MTS. Note no significant difference was observed in the two groups. B. PI- Annexin V staining determined by FACS analysis in microglia. C. Western blotting of caspase3 protein expression in BV-2 cells exposed to hypoxia for 2, 4, 6, 8 and 12 h and control (c). The left panel in C shows specific bands of cleaved caspase3 (17 kDa) and β-actin (43 kDa). The right panel in C is a bar graph showing significant changes in the optical density following hypoxic exposure (normalized with β-actin). Note significant increase in cleaved caspase3 expression after hypoxic treatment of varying durations in BV-2 cells, especially at 8 h. D. Confocal images showing cleaved caspase3 expression in control BV-2 cells and those exposed to hypoxia for 8 h. Weak cleaved caspase3 expression is detected in the control BV-2 cells with enhanced immunofluorescence intensity after 8 h of hypoxic exposure. The experiments have been repeated at least in triplicate. Significant differences between control and hypoxic BV-2 cells are calculated using Student’s t-test and expressed as *p < 0.05 and **p < 0.01. The values represent the mean ± SD in triplicate. Scale bar in D = 20 μm.

