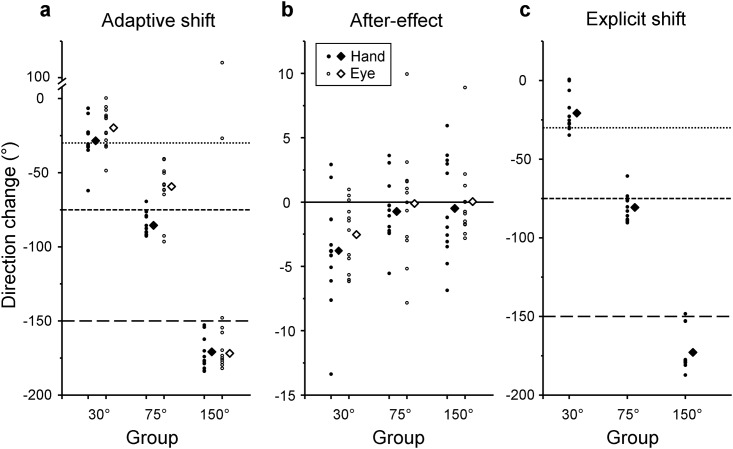
Fig 8. Adaptive shifts (a), after-effects (b), and explicit shifts (c).
Individual values (circles) and mean values of all participants (diamonds) are plotted against groups. Filled circles and open circles refer to hand and eye movements, respectively. Horizontal dotted line, dashed line, and long-dashed line refer to the values that would be obtained when 30°, 75°, and 150° visuomotor rotations, respectively, are fully adapted.

