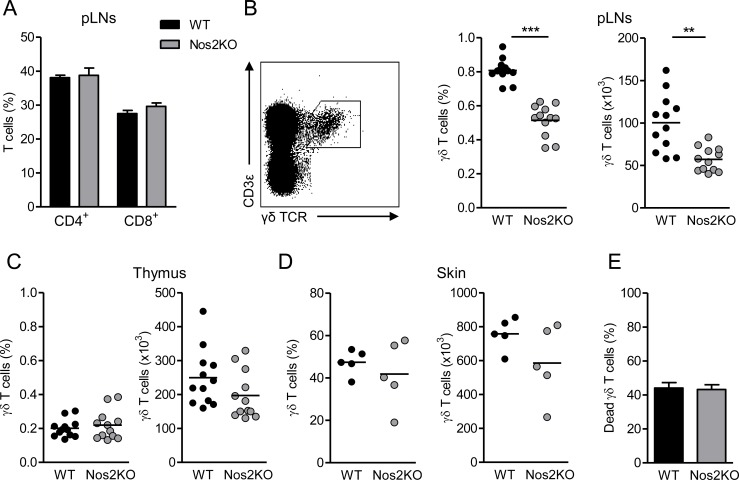
Fig 1. Influence of NOS2 deficiency on γδ T cells in vivo.
(A) Percentages of CD4+ and CD8+ αβ T cells from pLNs of WT (n = 12) and Nos2KO (n = 12) mice. (B-D) Representative dot plot of peripheral γδ T cells defined as CD3ε+TCRγδ+ cells (B—left). Percentages and absolute numbers of γδ T cells from pLNs (B), thymus (C) and skin (D) of WT (n = 12, except for E n = 5) and Nos2KO (n = 12, except for E n = 5) mice. (E) Proportion of dead γδ T cells from pLNs of WT (n = 10) and Nos2KO (n = 9) mice analyzed ex vivo by annexin V staining. Data are pooled from one (D), two (B, C) or three (A, E) experiments. Bars are mean or mean ± SEM and each point represents one mouse. ** p<0.01, *** p<0.001 (Mann-Whitney’s test).

