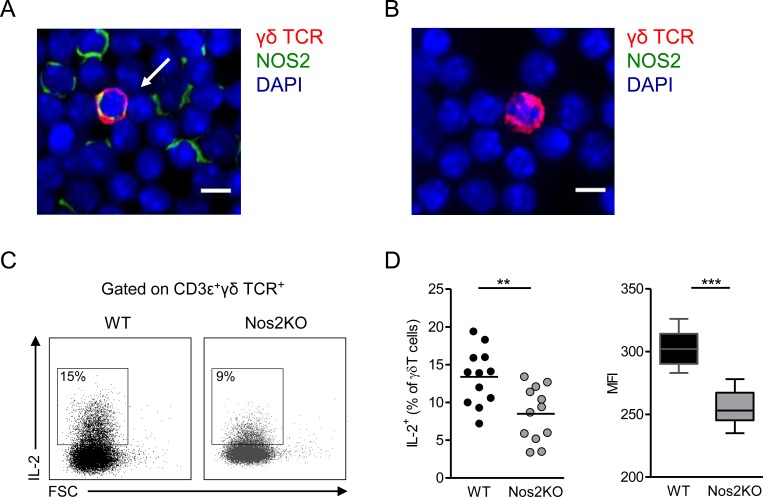
Fig 2. Effect of NOS2 deficiency on IL-2 production by pLNs γδ T cells.
(A-B) Representative microscopy images showing a γδ T cell positive (A) or negative (B) for NOS2 derived respectively from pLNs of WT and Nos2KO mice and stained with antibodies to TCR γδ (red), NOS2 (green) and counterstained with DAPI (blue). The arrow indicates a NOS2+ γδ T cell. Bars 10 μM. 40 X objective. The experiment was performed from WT (n = 3) and Nos2KO (n = 2) mice. (C-D) IL-2 production by γδ T cells after 4h PMA/ionomycin stimulation of pLNs from WT (n = 12) and Nos2KO (n = 12) mice. (C) Representative dot plots of IL-2 staining among γδ T cells in WT and Nos2KO mice. (D) Percentages of IL-2+ cells among γδ T cells are shown in left and geometric mean of fluorescence intensity (MFI) in right. Data are pooled from two experiments. Point represents individual mouse, bars are mean and box and whiskers are min to max values and median. ** p<0.01, *** p<0.001 (Mann-Whitney’s test).

