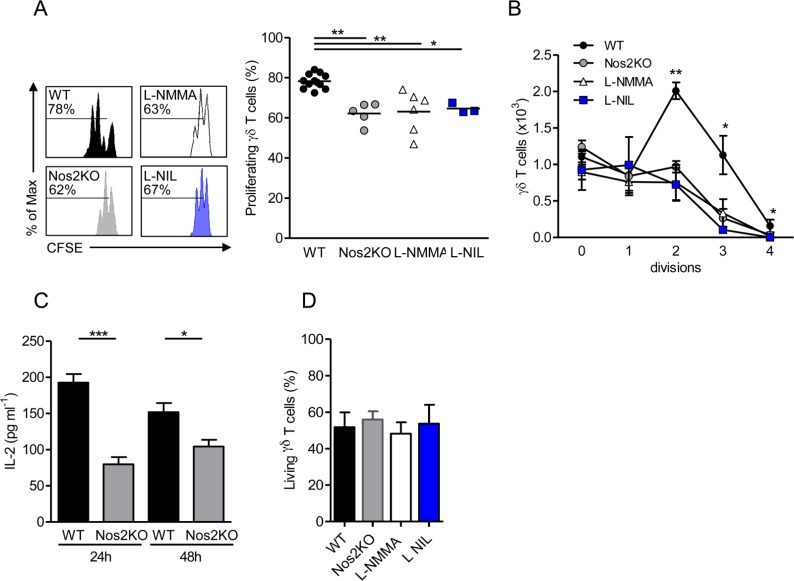
Fig 3. Effect of autocrine NOS2-derived NO on γδ T cell proliferation.
γδ T cells sorted from pLNs of WT or Nos2KO mice and labeled with CFSE were cultured for 2 days in presence of CD3- and CD28-specific antibodies, 0,5 mM L-NIL and 10 mM L-NMMA when indicated. (A) Representative histograms of CFSE dilution. Numbers above line on CFSE plots indicate percent of proliferating cells (left). Percentages of γδ T cell proliferation undergoing division (right). (B) Number of γδ T cells by division. (C) IL-2 levels quantified in supernatants by ELISA after 24h and 48h of γδ T cell cultures. (D) Proportion of living γδ T cells after 48h culture. Data are from five independent experiments with 12 WT, 5 Nos2KO, 3 L-NIL and 6 L-NMMA replicates. Point represents individual replicate, bars mean ± SEM (except in B right mean) * p<0.05 ** p<0.01, *** p<0.001 (Mann-Whitney’s test).

