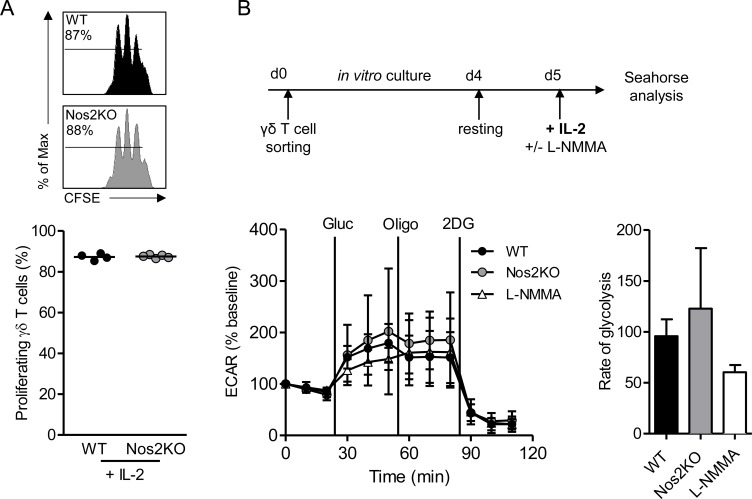
Fig 5. Proliferation and glycolysis of NOS2-deficient γδ T cells in presence of IL-2.
(A) γδ T cells sorted from pLNs of WT and Nos2KO mice and labeled with CFSE were cultured for 2 days in presence of CD3 and CD28-specific antibodies and 15U/mL IL-2. Numbers above line on CFSE plots indicate percent of proliferating cells. Percentages of γδ T cell proliferation are shown below. Data are representative of two experiments with 4 WT and 5 Nos2KO replicates. (B) Sorted γδ T cells from pLNs were expanded in vitro for 4 days in presence of CD3 and CD28-specific antibodies, 15 μg/mL IL-7 and 15U/mL IL-2. ECAR was analyzed after 18h of resting followed by an additional 4h of stimulation with 15U/mL IL-2. Media contain 5 mM L-NMMA when indicated. Shown are normalized time courses as % of baseline and calculations of rate of glycolysis Data are pooled from three independent experiments with 7 (WT), 5 (Nos2KO) and 5 (L-NMMA) replicates Mean ± SEM are shown. (Mann-Whitney’s test).

