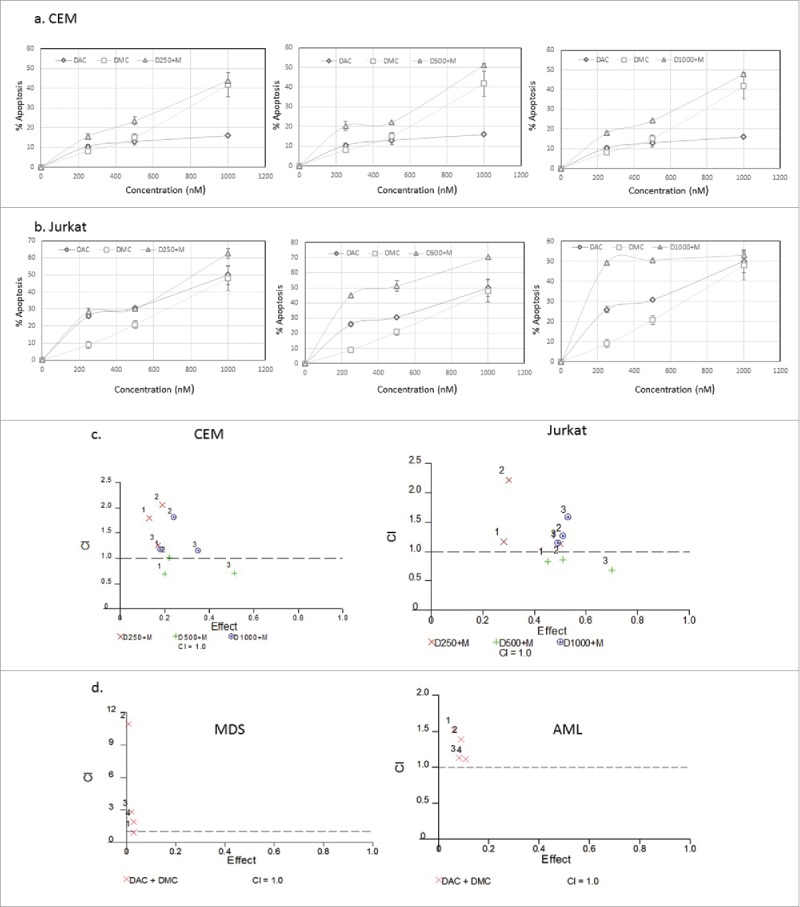
Figure 1.

Effect of simultaneous treatment with DAC and DMC on apoptosis induction in leukemia cells. a. CEM leukemia cells were treated with different concentrations of DAC, DMC, and the combination for 48 h and apoptosis induction was quantified as described under methods. The left, middle, and right panels: we used 250 nM, 500 nM, and 1000 nM of DAC in combination with different concentrations of DMC, respectively. b. Jurkat leukemia cells were treated with DAC, DMC, and the combination, similar to the treatment to CEM cells. In all experiments, data represent the mean ± SD for 3 replicates. c. Analysis of the synergistic and antagonistic effects of the combination on apoptosis induction. The combination index (CI) was calculated by CalcuSyn software for dose-effect analysis in CEM cells (left panel) and Jurkat cells (right panel). The combinations used were fixed concentrations of DAC with variable concentrations of DMC (250, 500, 1000 nM). d. Analysis of the synergistic and antagonistic effects of the combination on apoptosis induction in BMNC derived from MDS (left panel) and AML patients (right panel). ‘1′ indicates 100 nM DAC + 250 nM DMC, ‘2′ indicates 100 nM DAC + 500 nM DMC, ‘3′ indicates 250 nM DAC + 250 DMC, and ‘4′ indicates 250 nM DAC + 500 nM DMC. CI values equal to 1 are represented by the dashed line and considered additive, values greater than 1 are antagonistic, and values lower than 1 are synergistic.
