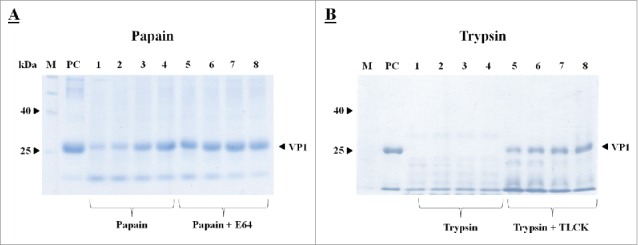
Figure 2.

SDS-PAGE analysis of VP1 susceptibility to papain (A) and trypsin (B). Samples were analyzed on a 12% SDS-polyacrylamide gel. All sample lanes contain 44 µg of VP1 treated with either papain or trypsin. Lanes 1 to 4 contain either papain (0.2 µg, 0.3 µg, 0.4 µg and 0.5 µg) or trypsin (0.2 µg, 0.3 µg, 0.4 µg and 0.5 µg). Lanes 5 to 8 contain VP1 treated with papain (0.2 µg, 0.3 µg, 0.4 µg and 0.5 µg) together with the cysteine protease inhibitor E64 (1 µM) or VP1 treated trypsin (0.2 µg, 0.3 µg, 0.4 µg and 0.5 µg respectively) together with the serine protease inhibitor TLCK (40 mM). PC (44 µg purified VP1) represents the positive control and M represents a pre-stained protein ladder.
