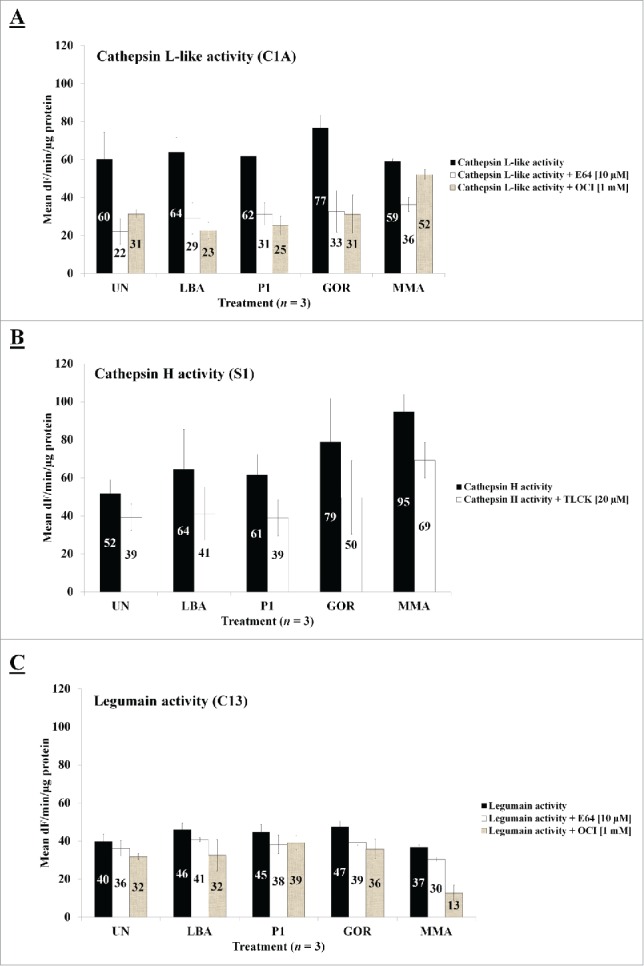
Figure 5.

Protease activities of cathepsin L-like, cathepsin H-like and legumain-like in control (UN & MMA) and experimental groups (LBA, P1 and GOR). (A) Cathepsin L-like activity, (B) cathepsin-H like activity, (C) legumain-like activity. The y-axis represents the mean activities expressed as fluorescence units (dF) per min per µg protein. Mean activities of 3 biological replicates are shown within bars. Error bars indicate standard error of the mean (SEM).
