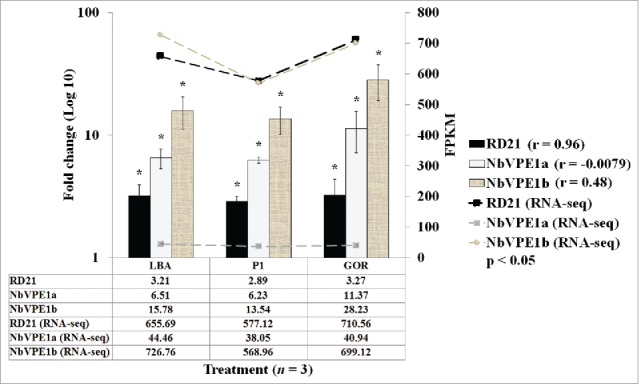
Figure 7.

Fold change and FPKM of gene expression of RD21 (black bars), NbVPE1a (gray bars) and NbVPE1a (canvas bars) in LBA, P1 and GOR experimental groups normalized to reference genes and relative to untreated control (UN) set at 1. Fold changes are represented on left y-axis as log 10 and samples are represented on x-axis. Error bars indicate standard error of mean (SEM) across 3 biological replicates. FPKM values of RD21 (black line), NbVPE1a (gray line) and NbVPE1b (canvas line) are represented on the right y-axis. ‘r’ refers to the Pearson correlation coefficient between RNA-seq and RT-qPCR gene expression measurements. Statistically significant differences between gene expression levels (RD21, NbVPE1a and NbVPE1a) in treatments (LBA, P1 and GOR) compared to control (UN) were determined by 2-factor ANOVA with replication (p-value< 0.001) and Bonferroni corrected post-hoc t-tests (p-value < 0.05) are represented as asterisks above graphs (*).
