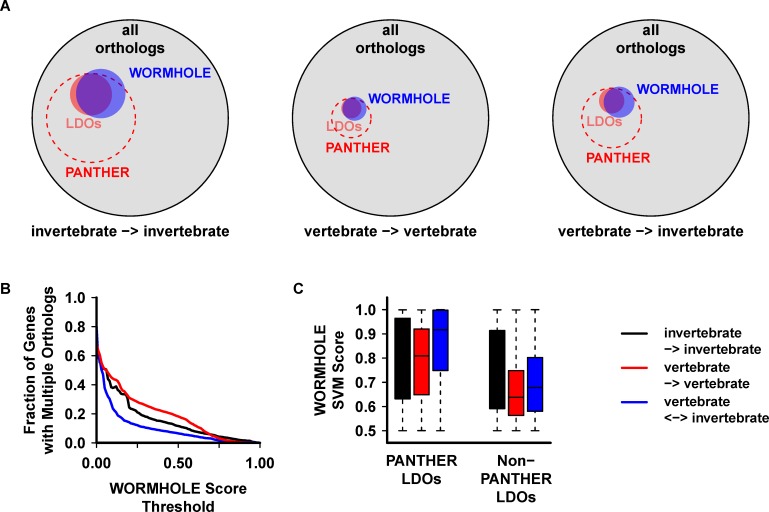
Fig 5. WORMHOLE SVMs reproduce the majority of PANTHER LDOs while expanding the total number of LDOs.
(A) Venn diagrams displaying the relative number of gene pairs in PANTHER, PANTHER LDOs, WORMHOLE (WOMRHOLE score ≥ 0.5). Outer circles represent the complete set of gene pairs predicted by all of the constituent algorithms. Circle areas are proportional to the number of gene pairs in each data set. (B) The number of query genes with multiple LDO predictions by WORMHOLE SVMs as a function of WORMHOLE Score threshold. (C) Box and whisker plot representing the range of WORMHOLE Scores assigned to PANTHER LDOs or non-PANTHER LDOs (gene pairs in the WORMHOLE database but not in the PANTHER LDO reference set) within the set of genes with multiple LDO predictions by the WORMHOLE SVMs (WORMHOLE score ≥ 0.5).

