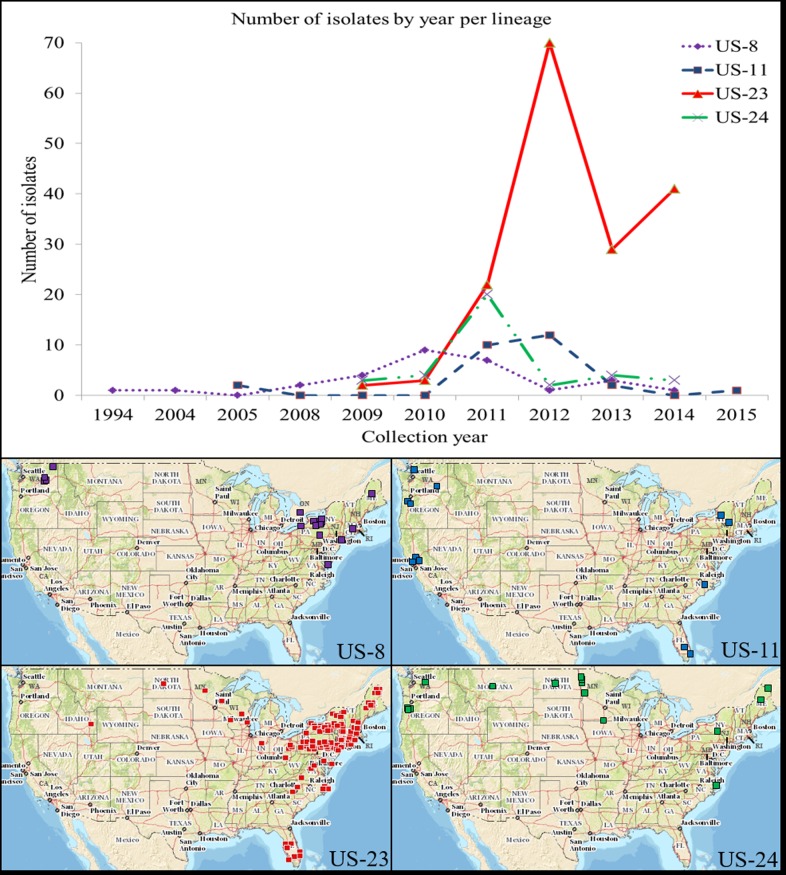
Fig 1. Number of isolates by year and collection location used in this study.
Top: each line represents a lineage (dotted line [US-8, n = 29], dashed line [US-11, n = 27], solid line [US-23, n = 167], dotted line with dashes [US-24, n = 36]). Bottom: collection location of isolates by lineage. In some cases, map markers represent multiple isolates collected from that location.

