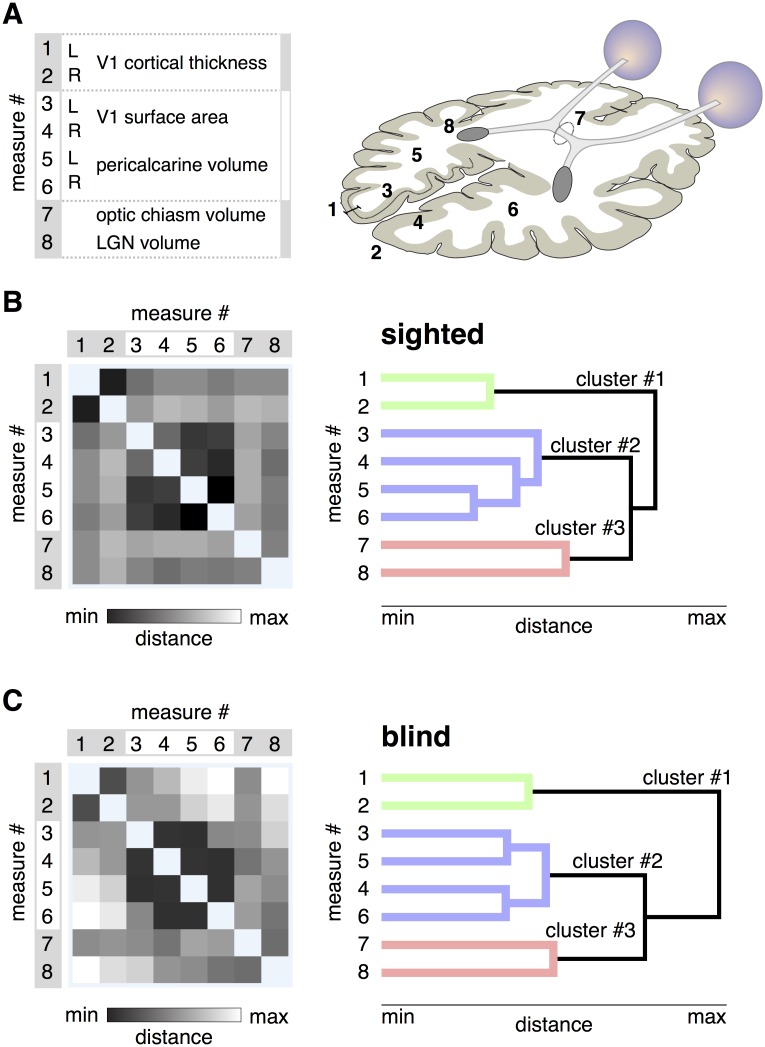
Fig 1. Patterns of shared variation in visual pathway anatomy.
A: The eight measures of visual pathway anatomy are illustrated on an axial schematic of the human brain. The groupings of the measures are to assist subsequent interpretation of the data. B: The Euclidean distance matrix and dendrogram for the 8 measures across the sighted population. Left. The square-root, sum-squared difference in values between two measures across subjects provides a measure of Euclidean distance. Darker shades indicate pairings of measures that have similar variation across subjects, and thus lower distance values. Right. The distance matrix was subjected to hierarchical clustering, yielding a dendrogram. The length of each branch reflects the distance between the paired measures. The three primary clusters of anatomical variation are colored green, blue, and red. C: Left. The distance matrix across the 8 measures for the blind population. A similar overall structure is seen as compared to the sighted. Right. The dendrogram derived from measures from the blind subjects. The same overall cluster structure is seen. Note that there is some rearrangement in the measurements assigned to cluster #2 in the blind as compared to the sighted.

