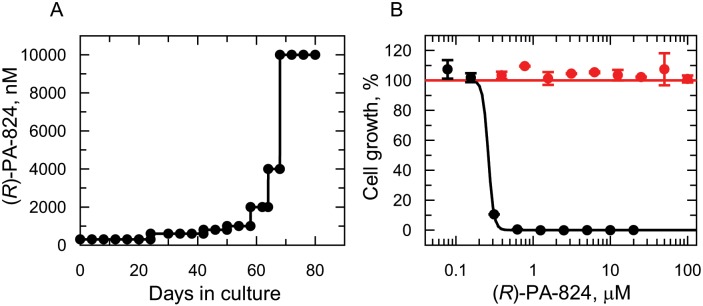
Fig 1. (R)-PA-824 resistance in vitro.
(A) Schematic representation of the generation of a (R)-PA-824 resistant cell line in Leishmania donovani. Each passage of cells in culture (black circles) is indicated. (B) Dose-response curves for WT (black circles) and RES III resistant cells (red circles). The curves are the non-linear regression fits using a two-parameter EC50 equation, yielding EC50 values of 262 ± 14 nM and > 100 μM for (R)-PA-824 against WT and RES III cells, respectively. Data are the mean ± standard deviation of triplicate cultures in a single experiment.

