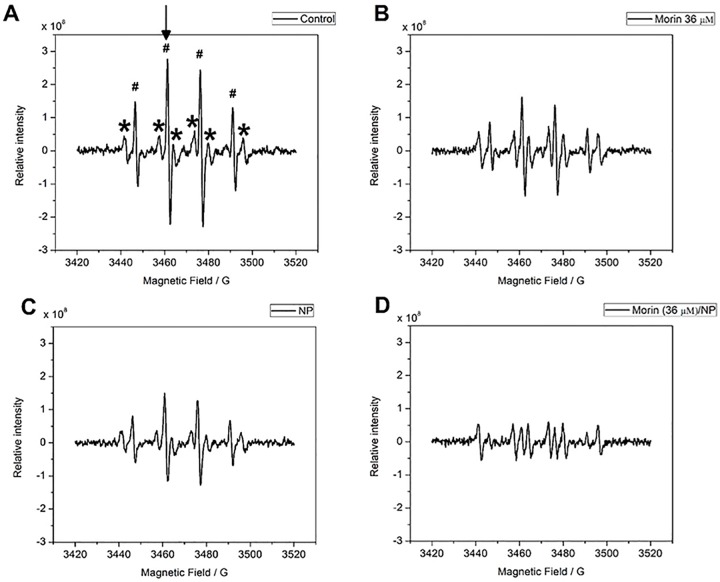
Fig 8. EPR spectra.
Control (DMPO + H2O2+glycerin 10%); (B) morin (DMPO + H2O2 + morin 0.11 mM/glycerin 10%); (C) AMSNPs (DMPO + H2O2 + NP 6800 mg L-1/glycerin 10%); (D) AMSNPs-MOR (DMPO + H2O2 + morin 0.11 mM/NP 6800 mg L-1 /glycerin 10%). In spectrum (A), the symbol (#) indicates the presence of DMPO-HO• adduct. The symbol (*) indicates the presence of the DMPO/glycerin adduct; and the arrow indicates the peak that was used for the analysis of each spectrum.

