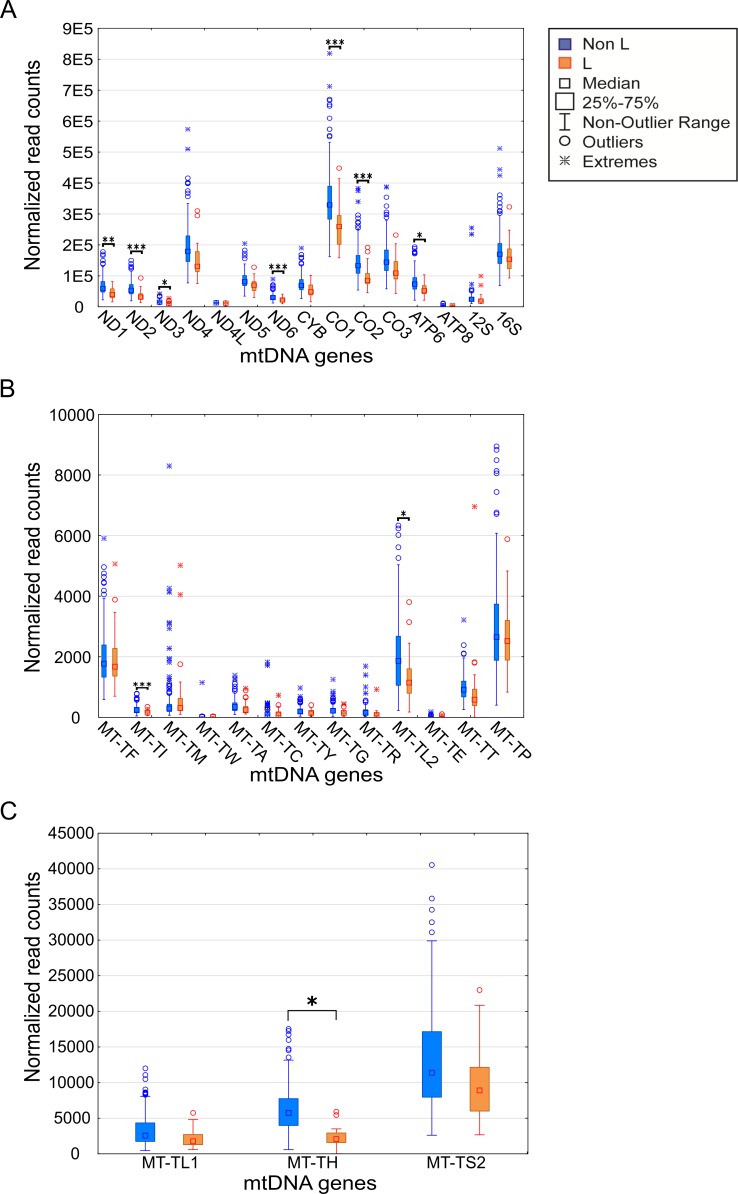
Fig 2. mtDNA gene expression is lower in L-haplogroup individuals.
Expression levels of the mtDNA genes in L-haplogroup and non-L-haplogroup individuals. Long RNA dataset (protein-coding genes and rRNA) (A). X axis–mtDNA genes, Y axis–DESeq normalized read count. (B) and (C) represent the tRNA dataset with lower and higher expression levels, respectively. Axes are as described in (A). Statistical significance: (*) p<3.7e-5; (**) p< 1e-6; (***) p< 1e-7.

