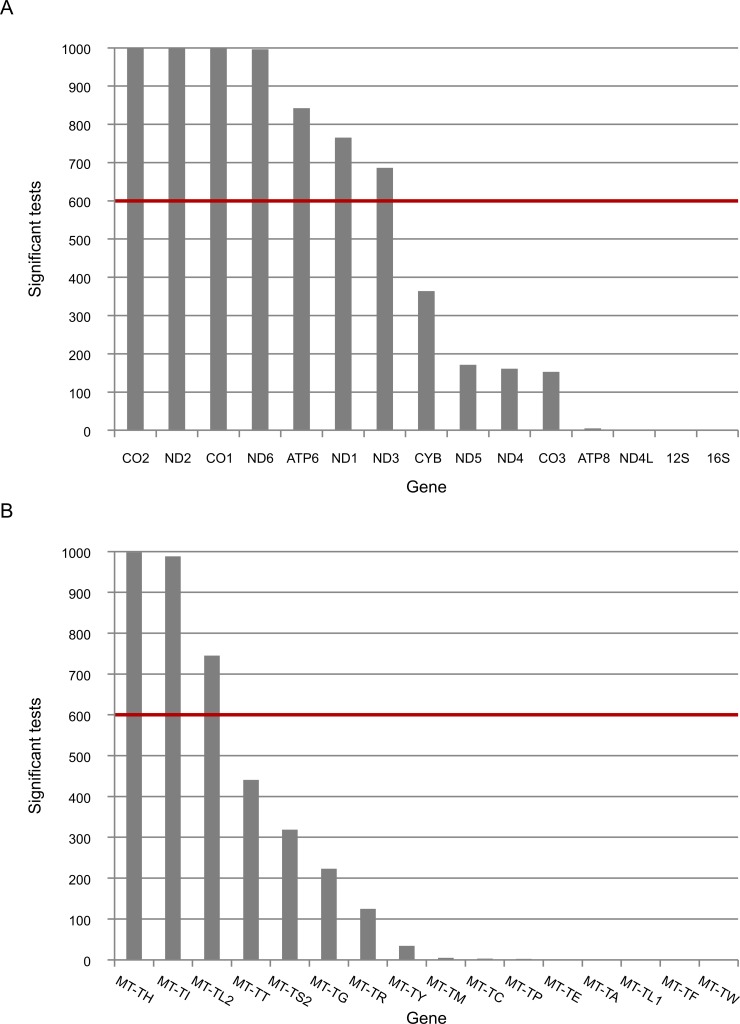
Fig 3. The expression of five mtDNA genes that diverged between L- and non-L-haplogroups in replicated association analyses.
Presented is the number of times that the expression of mtDNA genes was associated with L-haplogroup SNPs for the long RNA (A) and tRNA (B) datasets. The red line represents the cutoff value (60%). X axis–mtDNA annotation for protein (A) or tRNA genes (B), Y axis–absolute number of replicated associated analyses of mtDNA SNPs and mtDNA gene expression.

