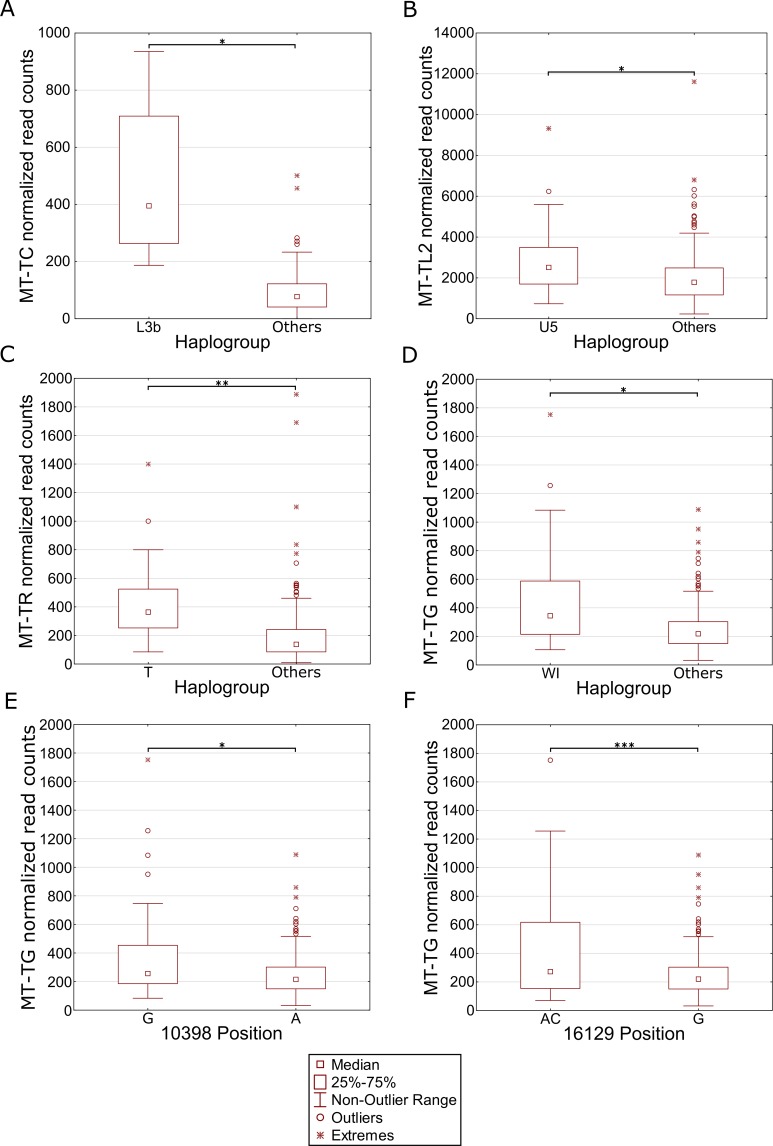
Fig 5. Differential expression of mtDNA genes in different haplogroups within populations.
Each panel represents a gene that differentially expressed within individuals harboring certain common SNPs in the African (A) and Caucasian (B-F) populations. X axis—SNP-associated haplogroups; 10,398 and 16,129 –mtDNA positions with common recurrent SNPs that showed differential expression; Y axis- normalized read counts. Statistical significance: (*) p< 3.55e-5; (**) p< 1e-6; (***) p< 1e-7.

