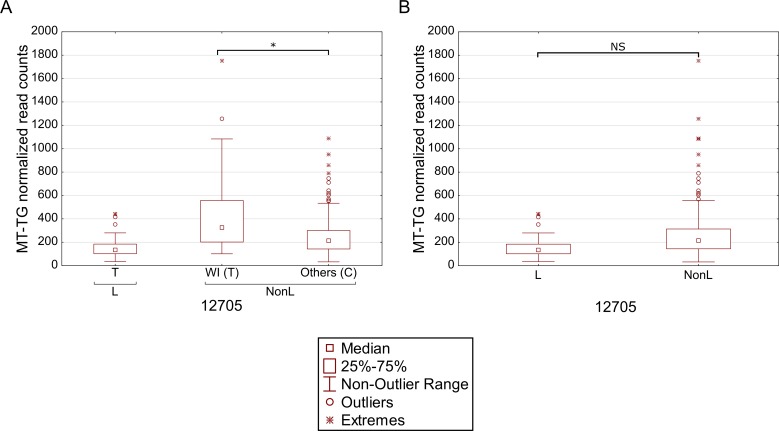
Fig 6. Masking of mtDNA expression differences within populations.
Differential expression of tRNA glycine in individuals with either the T or C alleles in mtDNA position 12,705, considering Caucasians and Africans, separately (A). Comparison of tRNA glycine expression in the entire dataset (B). L- Africans; NonL- Caucasians. X axis—SNPs within each haplogroup; Y axis- normalized read counts.

