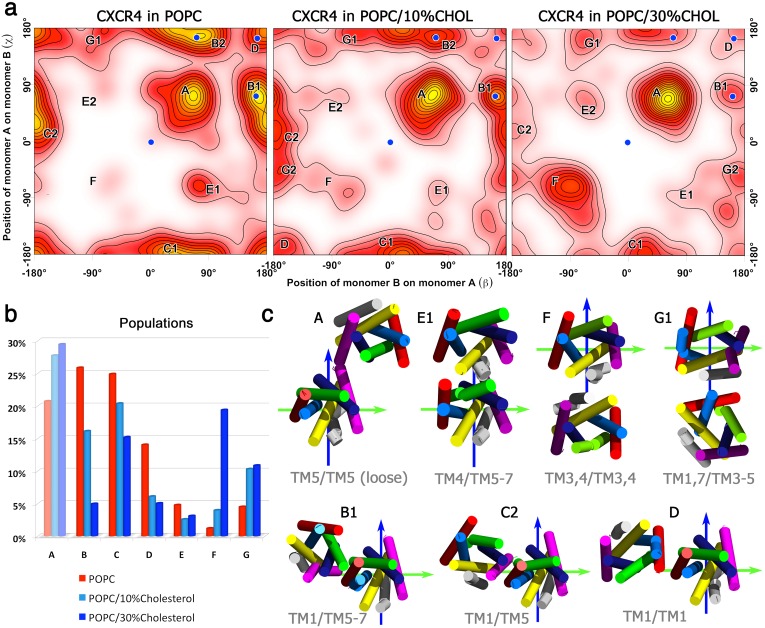
Fig 2. Spontaneously assembled CXCR4 dimers.
(a) Sampled CXCR4 dimer configurations in pure POPC bilayers after 3 μs (left), and in mixed POPC:cholesterol bilayers after 6 μs simulation time at 10% (middle) and 30% cholesterol content (right). The β and χ angles are defined relative to the crystal TM5,6/TM5,6 interface (central blue dots, see Methods Section for the exact definition of the angles β and χ). (b) Relative populations for the dimer configurations defined in (a) and (c). (c) Representative dimer configurations corresponding to labeled maxima A to G in (a) are shown in cylindric representation and colored equally as in Fig 1. Symmetric structures (C1 and C2 corresponding to TM1/TM5 and TM5/TM1, respectively) are distinguished by indices 1 and 2. The reference structure for all dimer configurations is indicated by green and blue axes.

