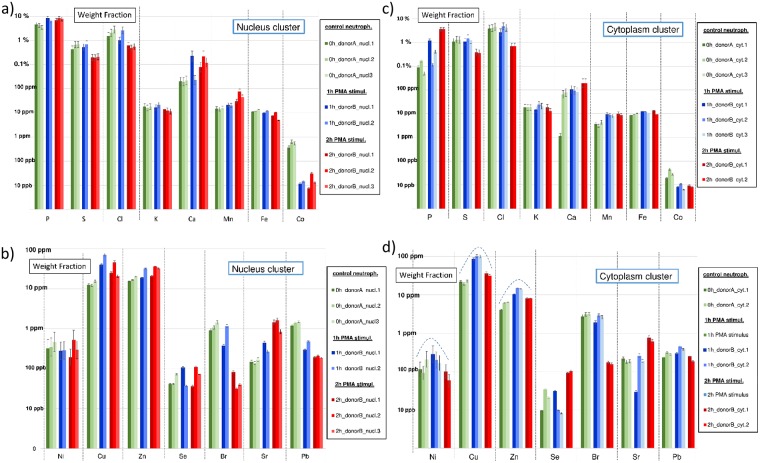
Fig 4. a-d: Bar graphs with element weight fractions within neutrophil nuclei (left column, Fig 4a-b) and cytoplasms (right column, Fig 4c-d) throughout PMA stimulation for P, S, K, Cl, K, Ca, Mn, Fe, Co (upper row) and for Ni, Cu, Zn, Se, Br, Sr and Pb (lower row).
Neutrophils from control culture are indicated in green, 1 h PMA-stimulated neutrophils in blue and 2 h PMA-stimulated neutrophils in red. Weight fractions are expressed in %, ppm or ppb in a (different) logarithmic scale. Weight fraction values are normalized to the Compton intensity of neutrophil “0h_donorA_ cell1”. Error bars are based upon Poisson counting statistics and the certified uncertainty values of NIST SRM1577C “Bovine liver”.

